- Material and Energy Flows – Überbauung Bombasei-Areal
- Material and Energy Flows - Überbauung Bombasei-Areal
Material and Energy Flows - Überbauung Bombasei-Areal
Section outline
-
-
What framework and limits for embodied GHG emissions should be used?
Today, greenhouse gas emissions occur across the entire life cycle of a building: construction, operation, maintenance, renovation, and demolition.
For this story, we use the Swiss SIA Climate Path (SIA 390/1:2025) as a reference framework. It considers emissions from construction and operation, excluding mobility, and provides a clear benchmark for evaluating the ecological performance of buildings in Switzerland.
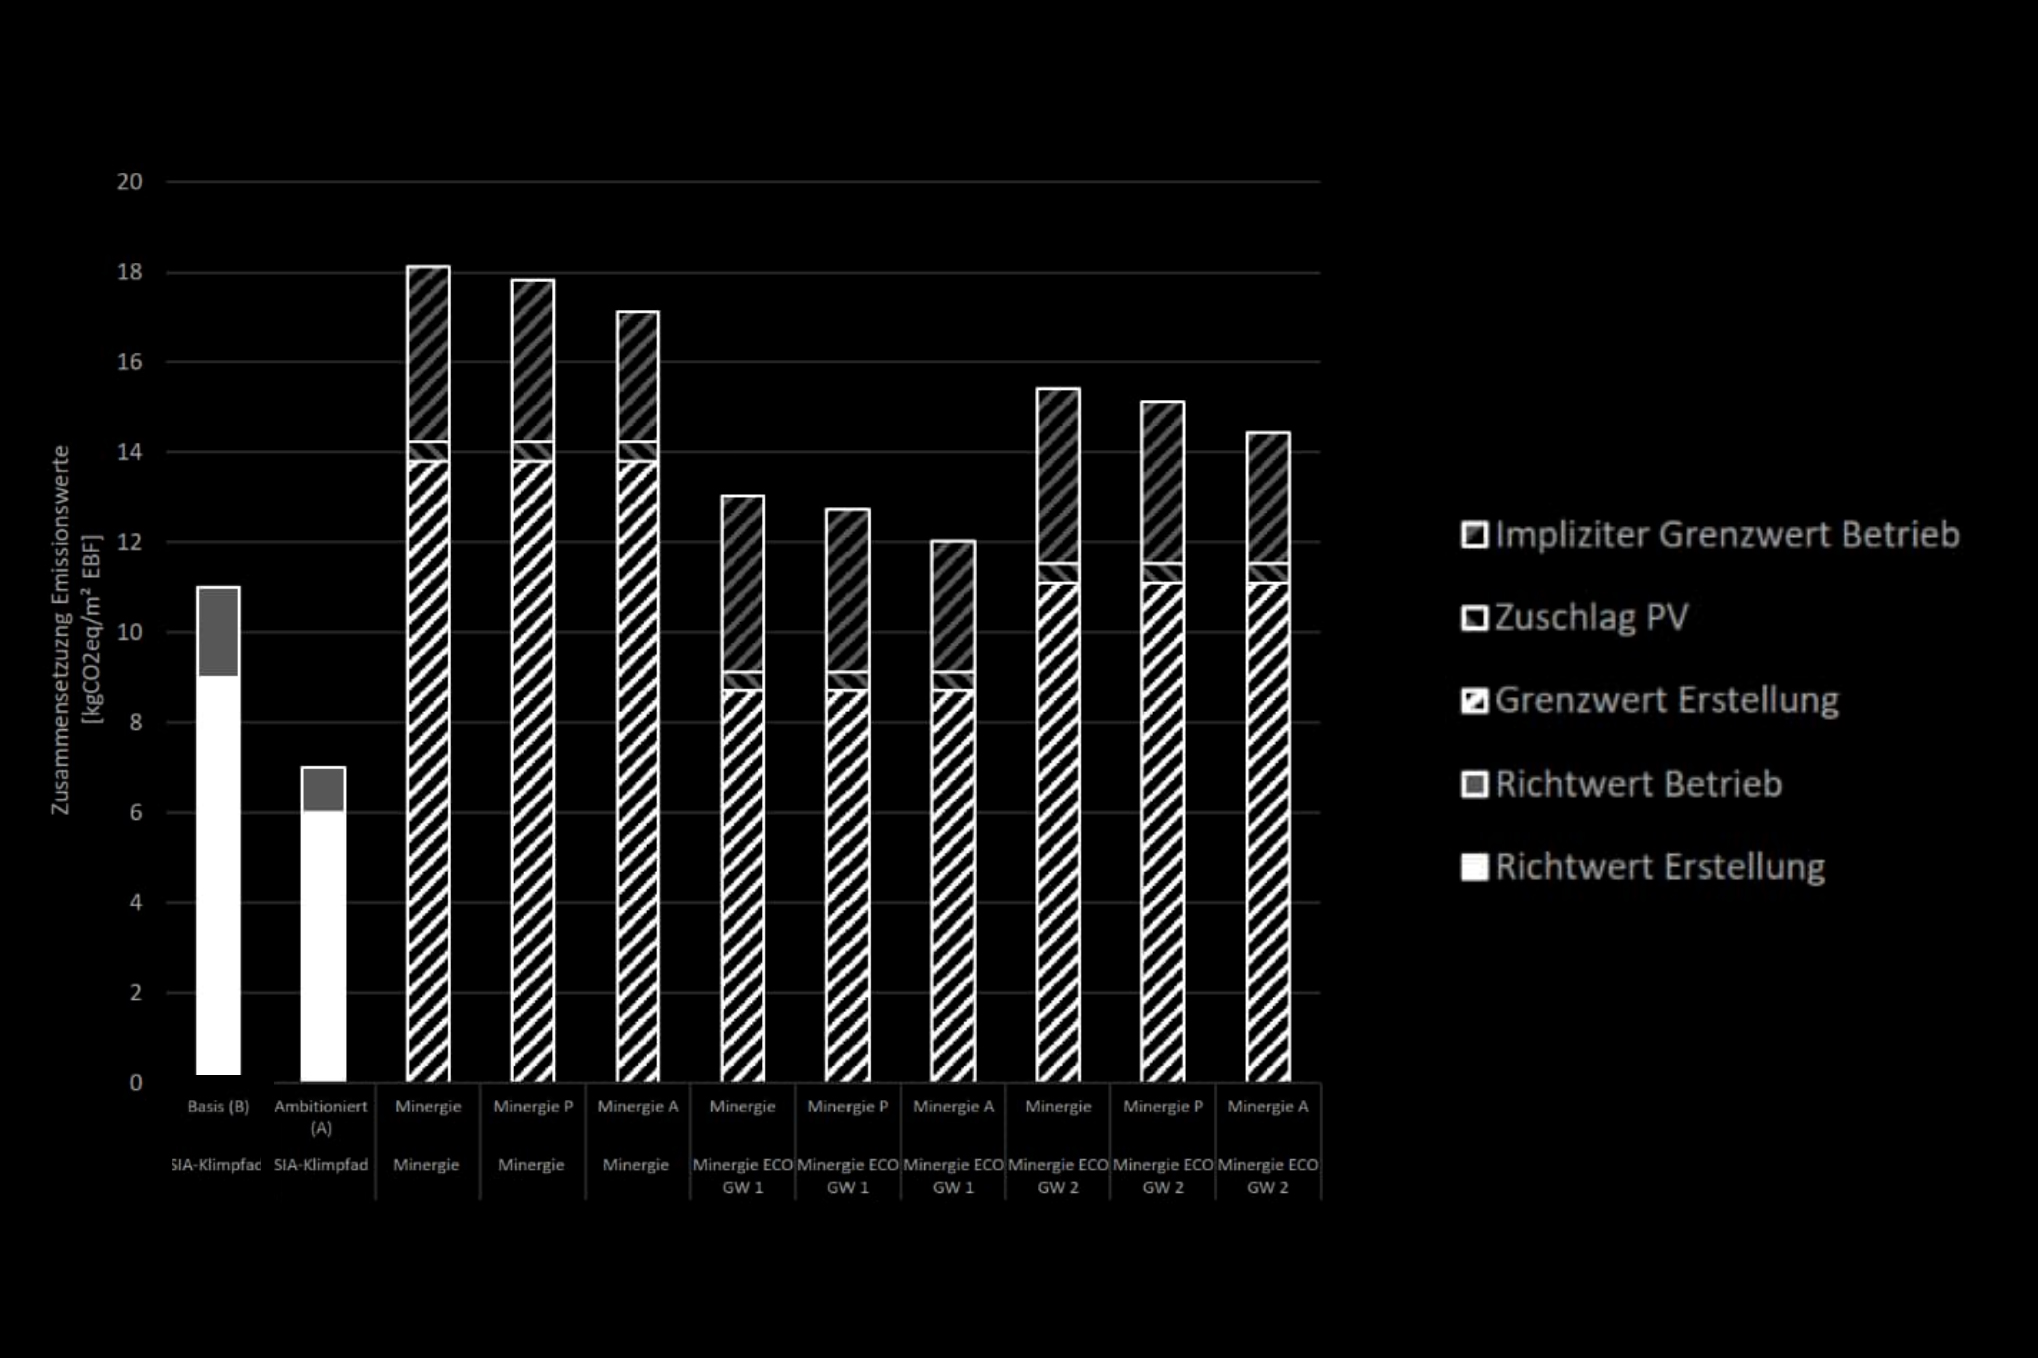
In the following graphic, we refer to the first two columns of SIA 390/1:2025, “SIA Klimapfad." GW1 represents the Ambitious target, while GW2 represents the Baseline target.
-

-
The comparison of limit and/or benchmark values for construction and operation, using the example of a new residential building. Source: Net-zero greenhouse gas emissions in the building sector; Federal Office of Energy, 2024.
-
Viride - sketching reality
Tool: viride
We start by exploring the Bombasei Areal using viride. With just a few basic inputs - location, year of construction, roof area, and the main building components - we can already translate architecture into measurable environmental data. Step by step, the building begins to reveal how it consumes energy, emits greenhouse gases, and stores carbon.
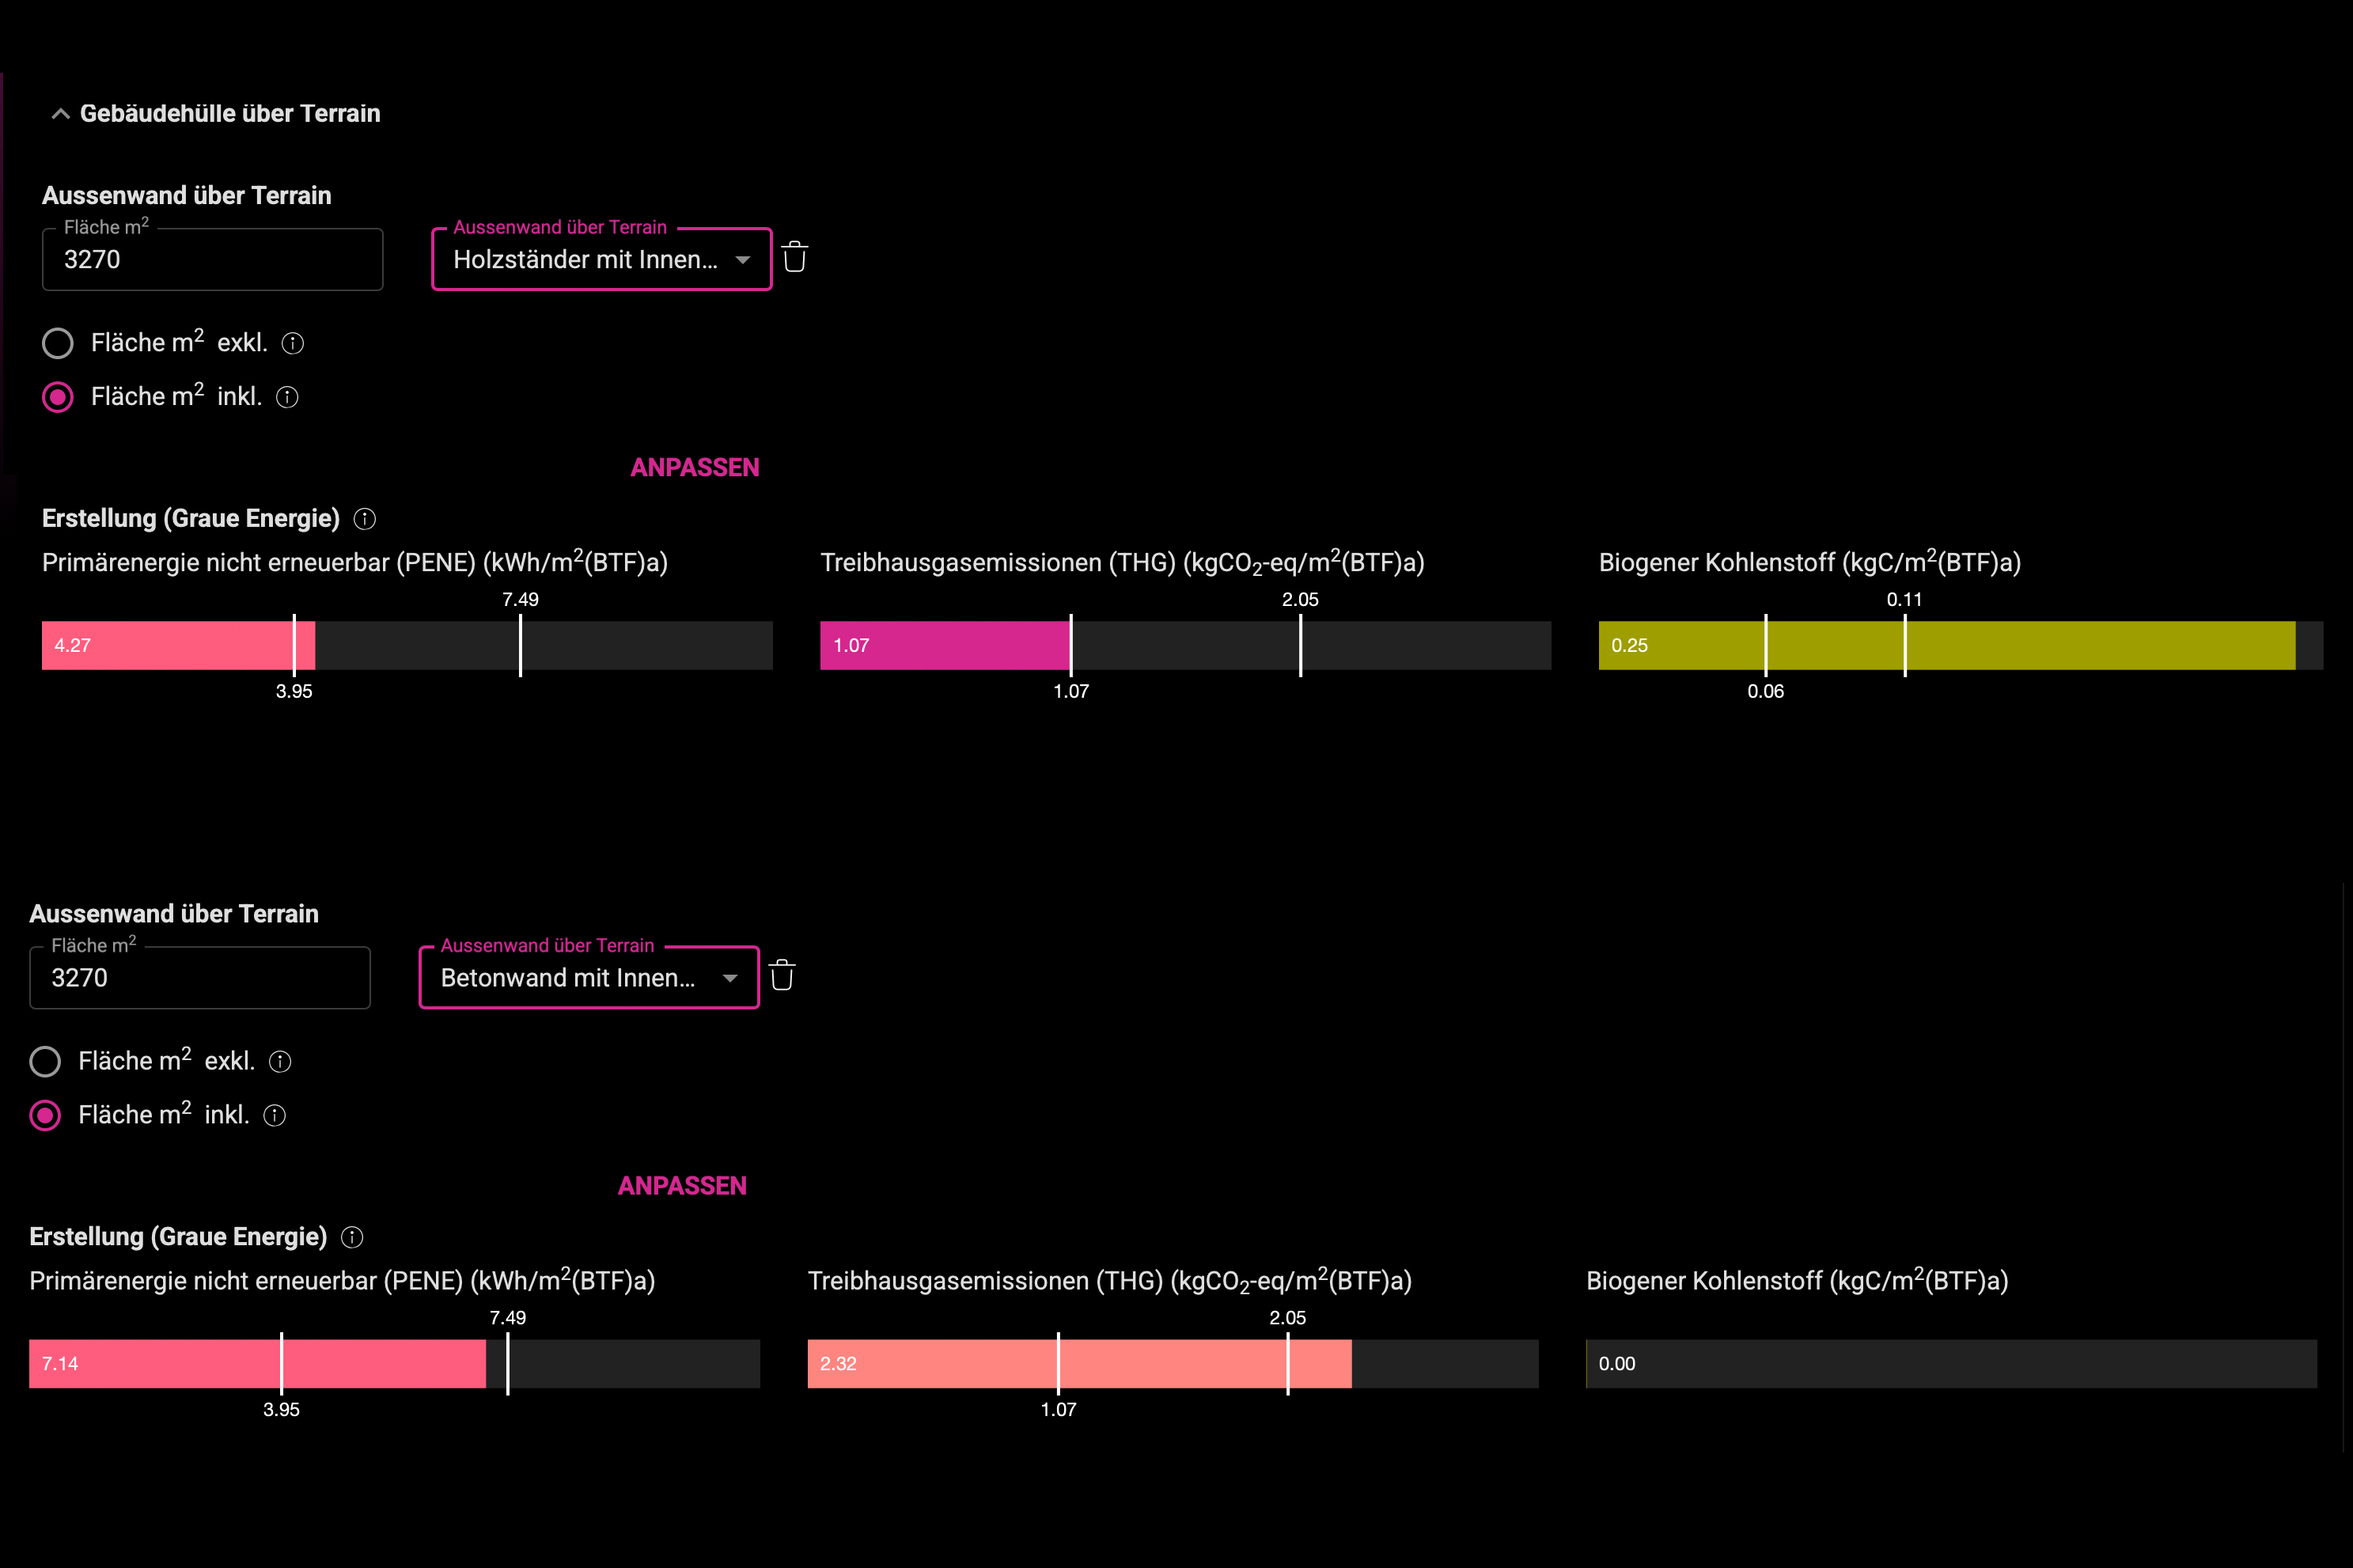
The most data intensive step focuses on the building components. For each element - foundations, external walls, or roof - we define its surface area and select the closest typology from a predefined list. We start with the external walls. According to the plans, they are made of cross-laminated timber, plastered on both sides, with straw insulation in between. By searching for the most similar construction typology in viride’s library, the tool immediately returns a first set of values:
- 4.27 kWh/m²(ERA)a Primary Energy Non-Renewable
- 1.07 kgCO₂-eq/m²(ERA)a Greenhouse Gas emissions
- 0.25 kgC/m²(ERA)a Biogenic carbon
Already, we can see that the walls are doing more than holding up the building, they are storing carbon while using energy efficiently. Let’s experiment: what if these walls were made of reinforced concrete instead of timber? Instantly, the numbers change:
- 7.14 kWh/m²(ERA)a Primary Energy Non-Renewable
- 2.32 kgCO₂-eq/m²(ERA)a Greenhouse Gas emissions
- 0 kgC/m²(ERA)a Biogenic carbon
The energy demand rises, emissions grow, and the carbon storage disappears. Just like that, we see the climate impact of a single material decision.

-

-
Comparison between two different external walls
-
When construction type and dimensions are defined for all components, VIRIDE reads the Bombasei-Areal as a complete system of material, energy, and emission flows. It introduces two temporal perspectives: construction and operation.
For the construction phase, the results are:
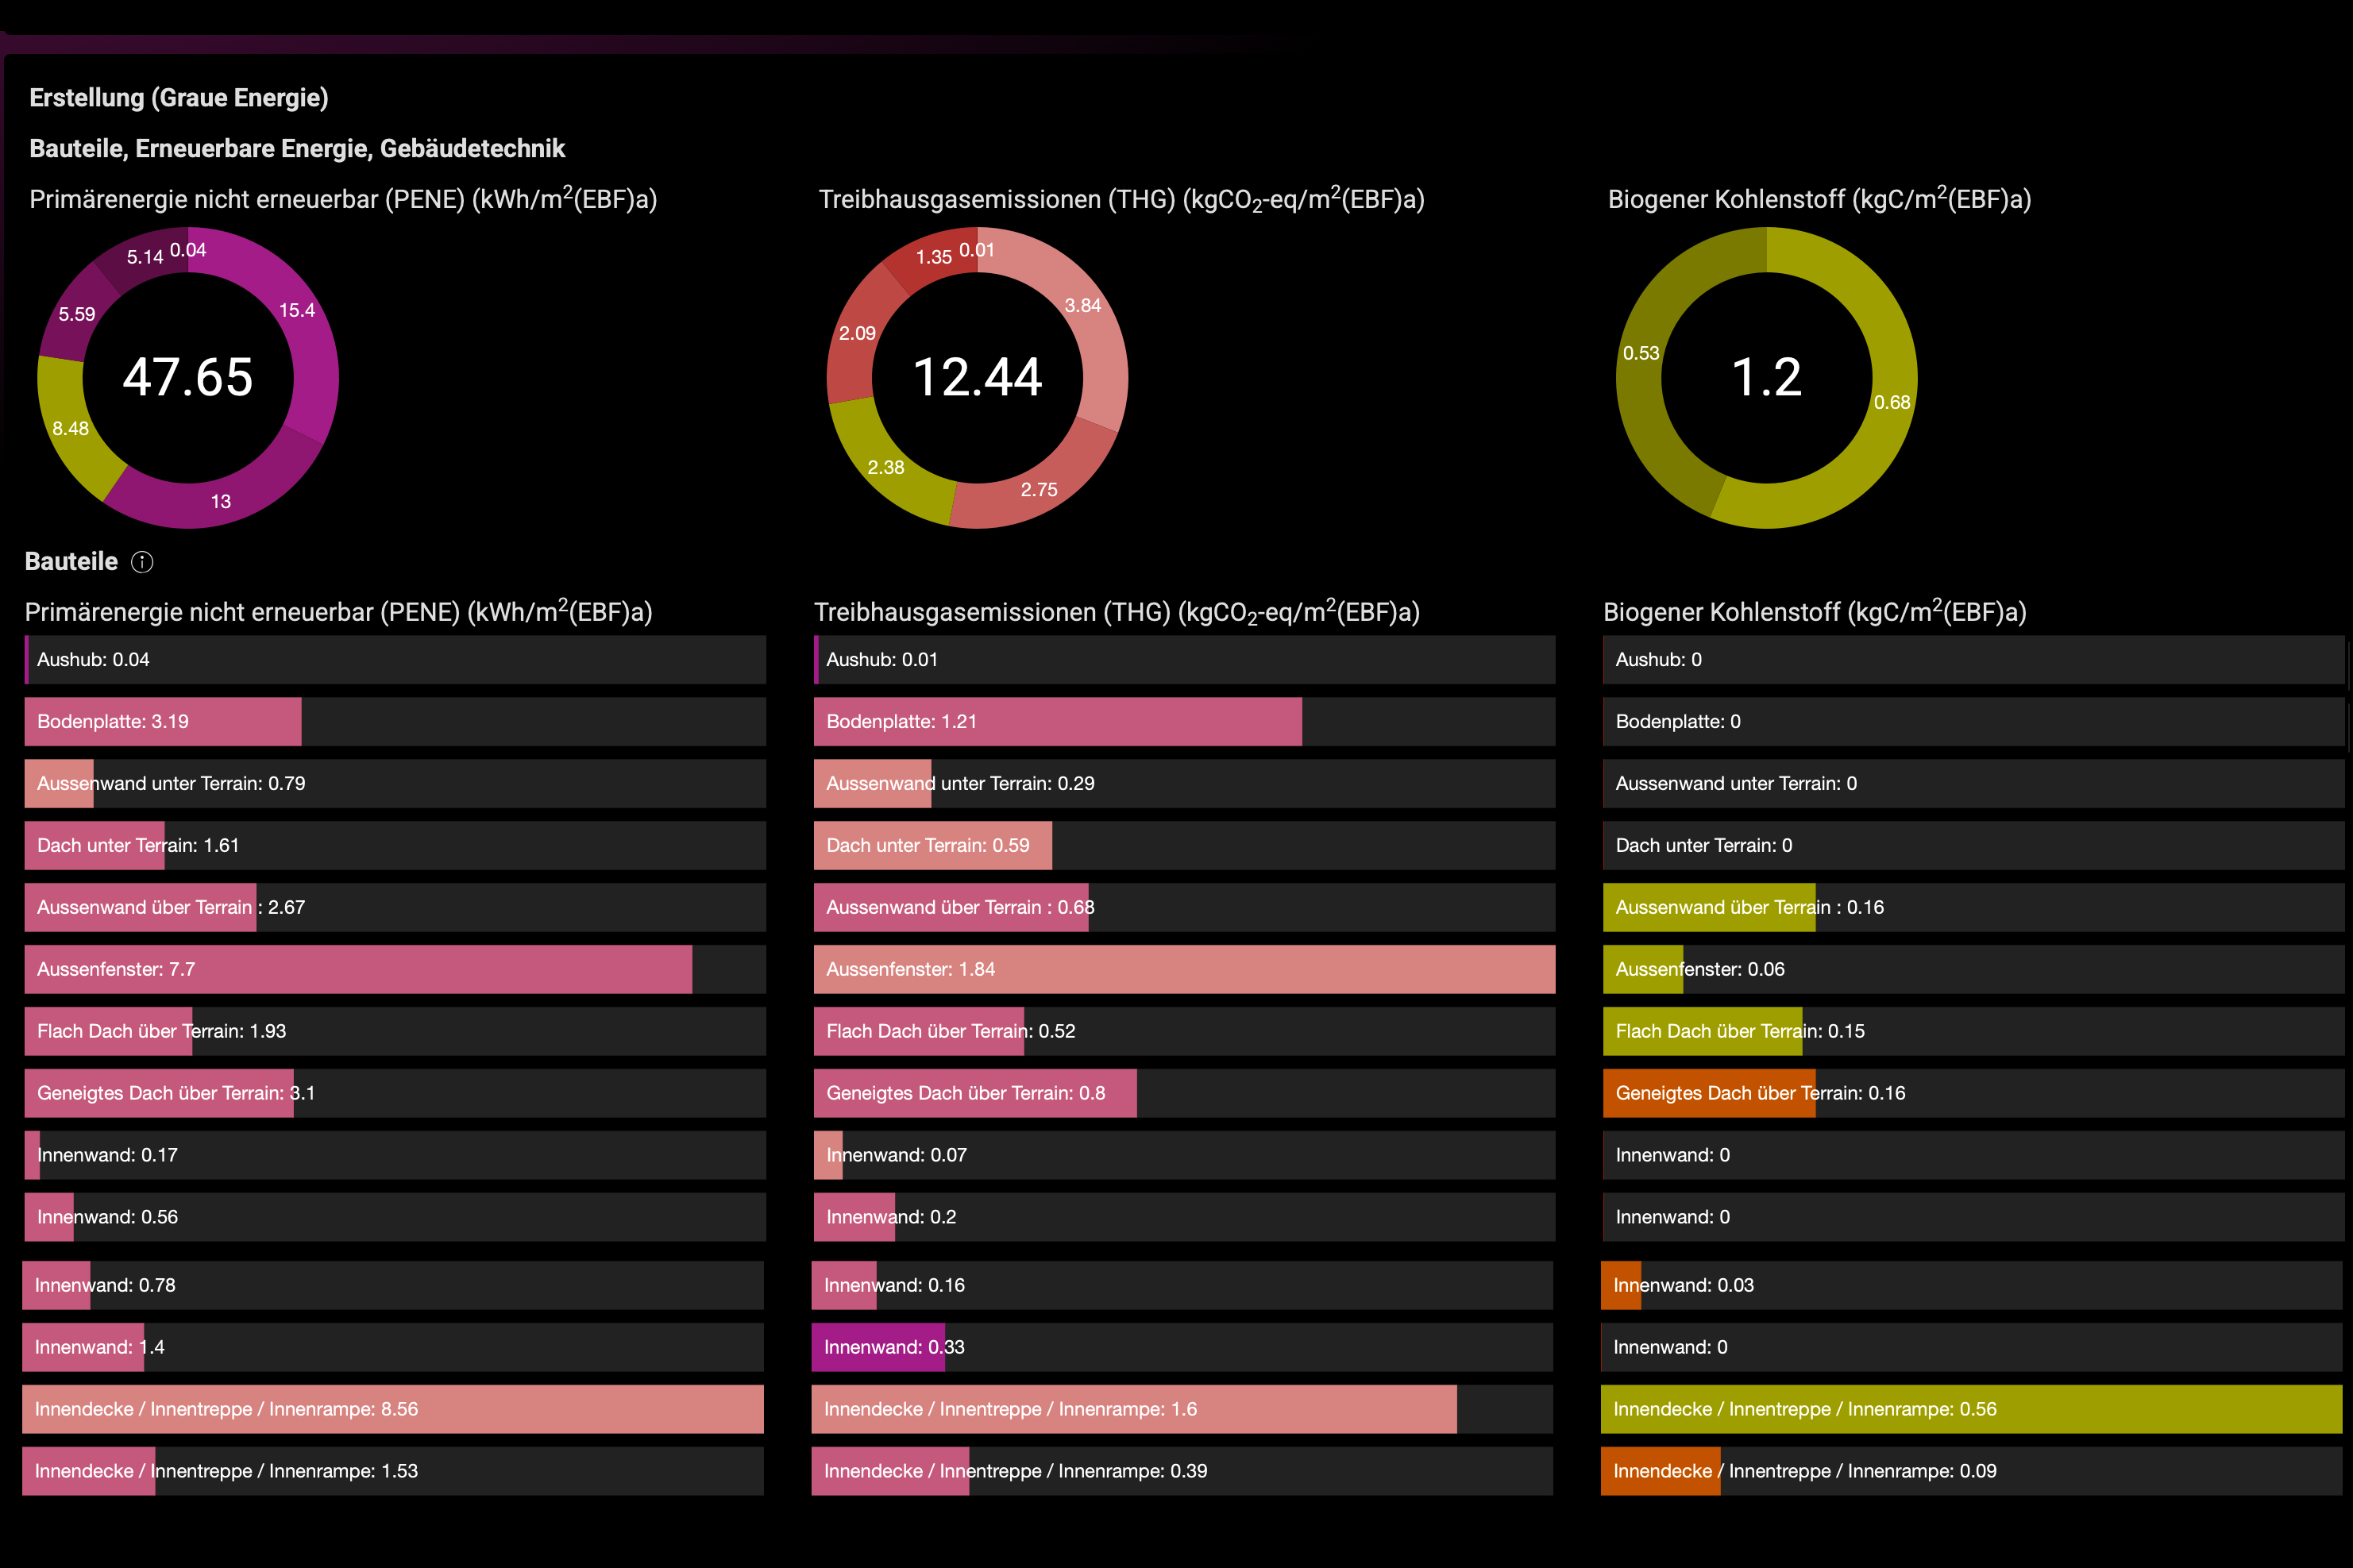
- 47.65 Primary Energy Non-Renewable (PENR) in kWh/m²(ERA)a
- 12.44 Greenhouse Gas emissions (GHG) in kgCO₂-eq/m²(ERA)a
- 1.2 Biogenic carbon in kgC/m²(ERA)a
Conventional residential buildings with concrete structures typically reach 20–30 kgCO₂-eq/m²a and store almost no biogenic carbon. Bombasei therefore follows a clearly different material logic: lower emissions and measurable carbon storage within the building fabric.
-

-
The diagram shows the results of the VIRIDE simulation for non-renewable primary energy (PENE), greenhouse gas emissions (GHG), and biogenic carbon per square meter of gross floor area per year.
-
The values appear slightly higher than the SIA benchmarks. This is mainly due to viride’s use of predefined typologies. The actual external wall of the Bombasei-Areal is a lightweight, multi-layered system composed of lime plaster, straw insulation, CLT panels, gypsum fibre boards, and an interior lime plaster finish. This precise stratification, and especially the use of straw as a bio-based insulation material, cannot be fully represented in viride’s catalogue.
At the Bombasei-Areal, approximately 420 tons of straw are used. With a carbon storage factor of about –1.34 kg CO₂ per kilogram of straw, this corresponds to roughly 560 tons of CO₂ stored in the building fabric. This significant contribution is therefore not fully visible in the current viride results, meaning that the project’s actual biogenic carbon storage is higher than what the tool indicates.
This highlights both a limitation and a strength of viride. Its limitation lies in the simplified representation of complex, bio-based construction systems. At the same time, its strength lies in providing a robust framework for comparison and early-stage assessment. viride thus functions as a reliable point of orientation rather than a complete representation, supporting informed decision-making while indicating where more detailed, material-specific analyses are required.
-
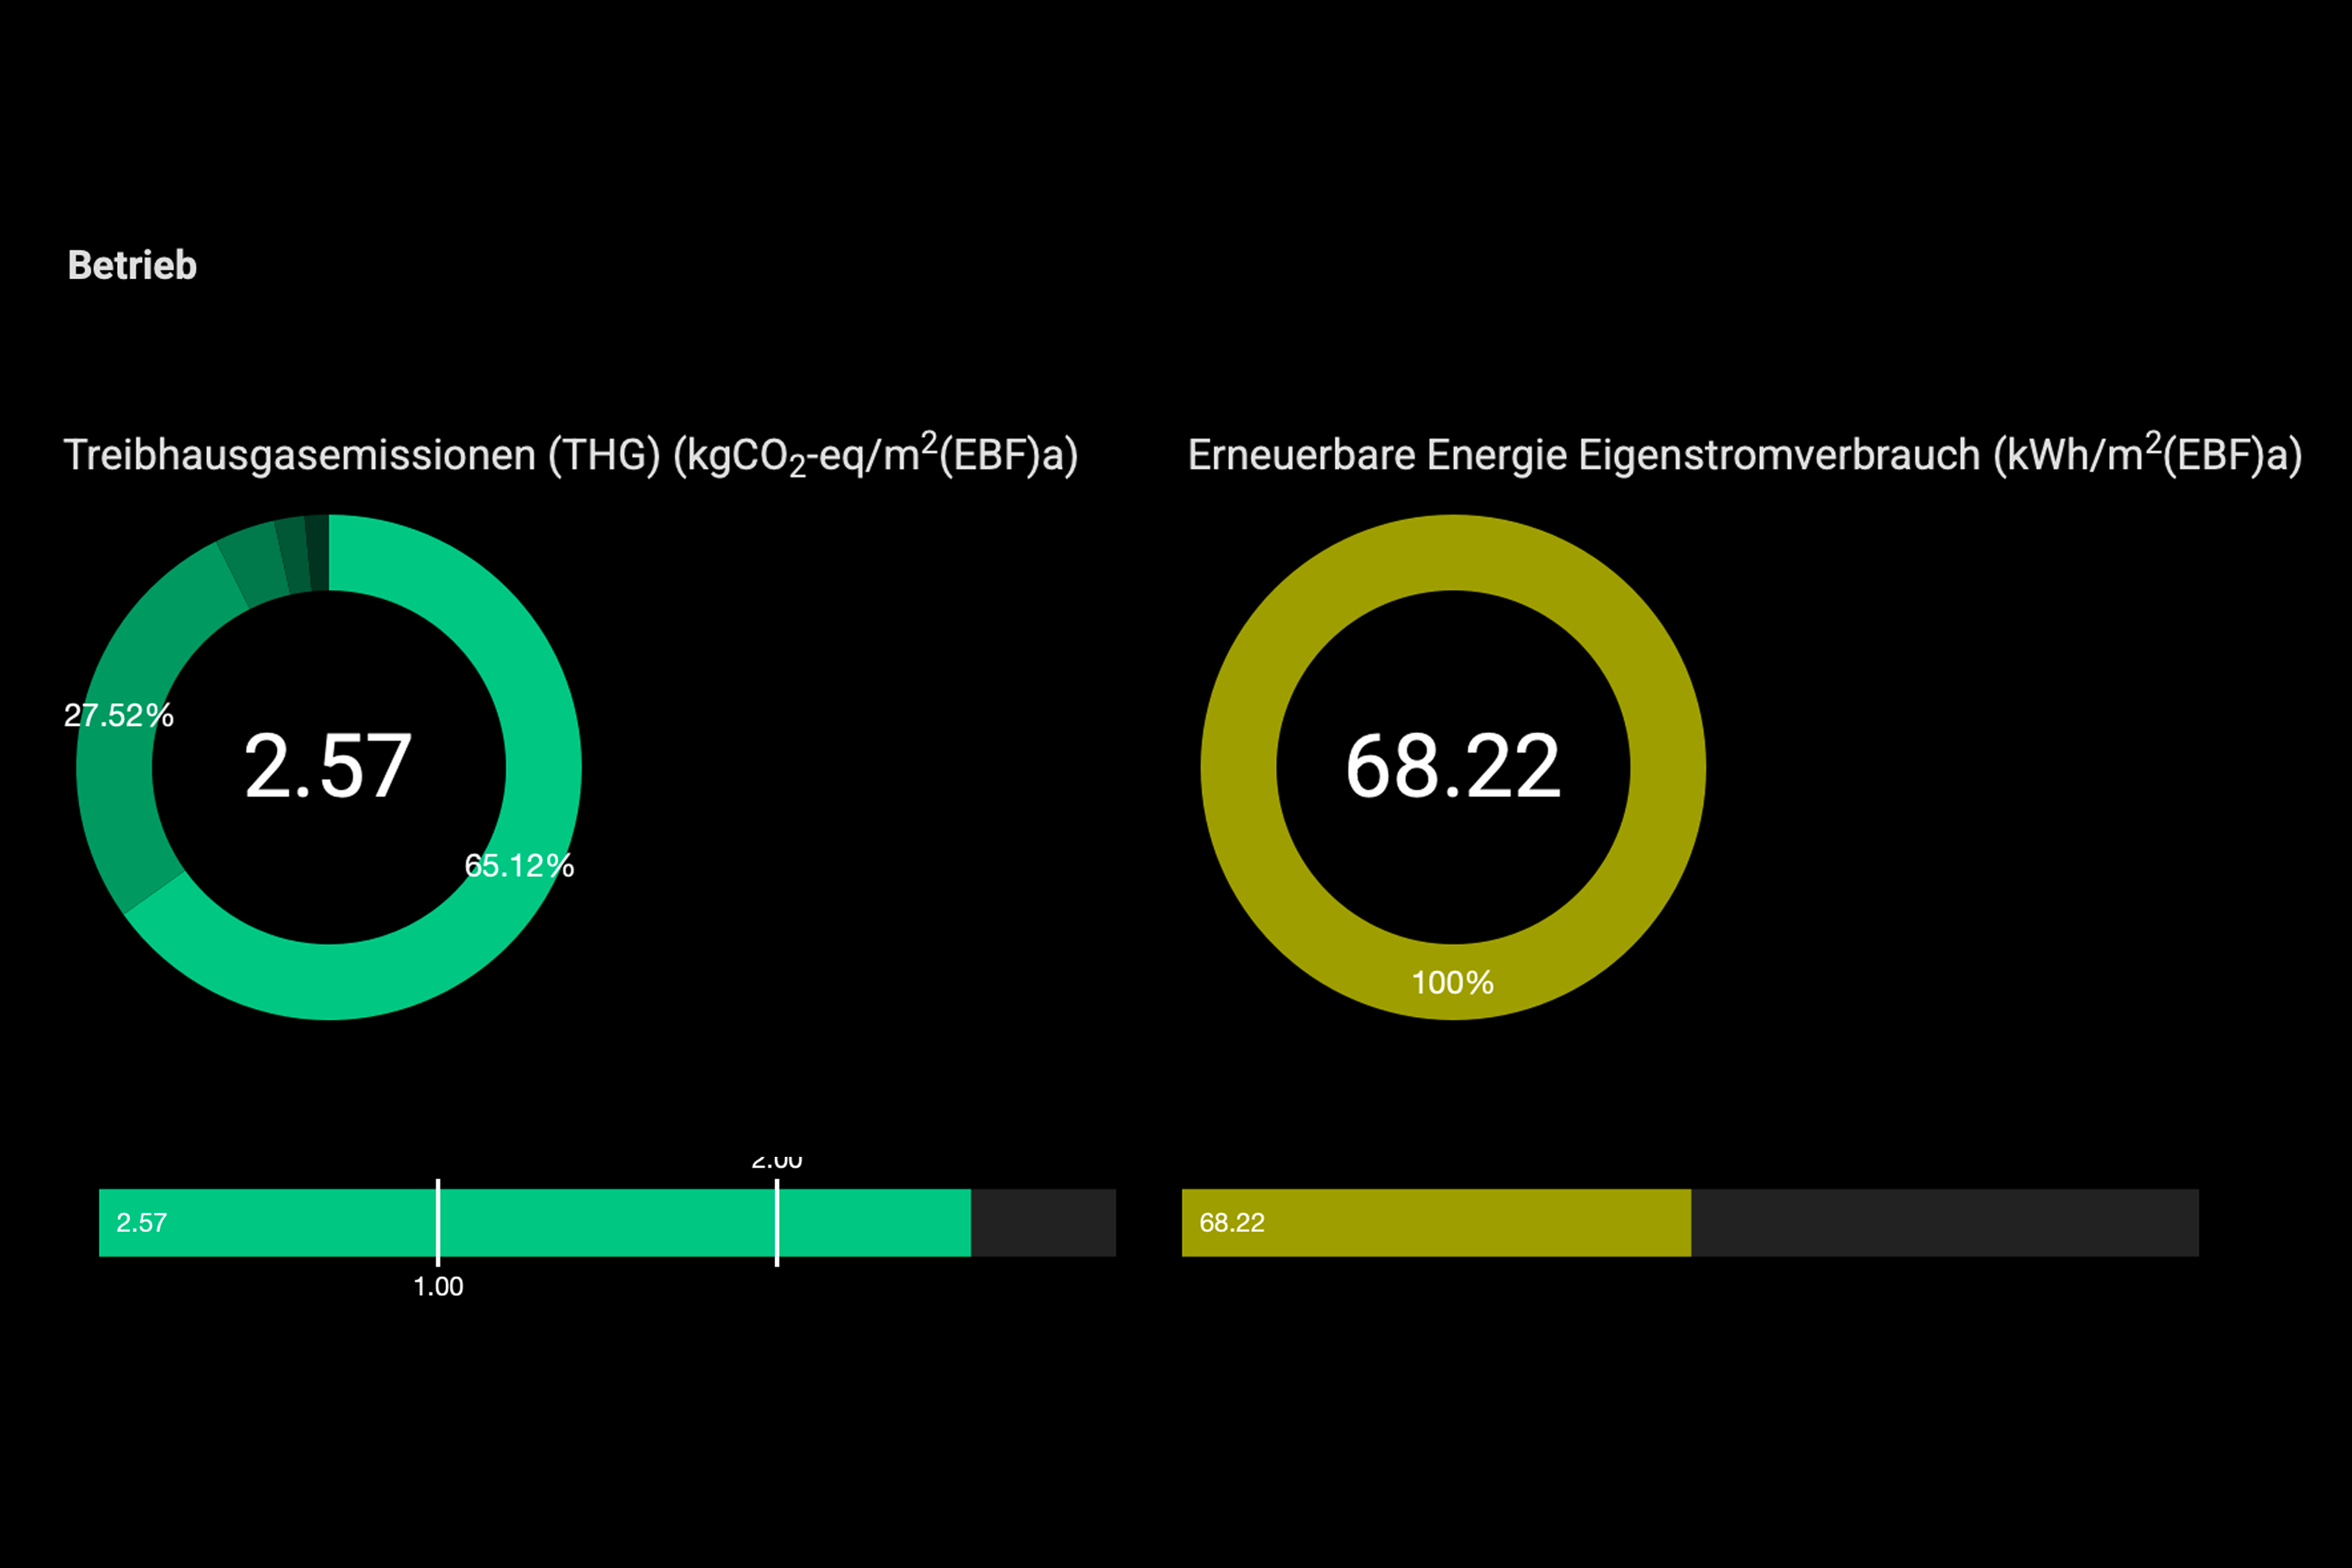
What does the second temporal perspective tell us? It shifts the focus to the operation of the building. Here, VIRIDE shows how the Bombasei-Areal performs in everyday use, beyond the impact embedded in its materials. For the operational phase, the results indicate:
-
2.57 kgCO₂-eq/m²(ERA)a Greenhouse Gas (GHG) emissions
-
68.22 kWh/m²(ERA)a Renewable energy own consumption, generated by the photovoltaic pitched roof
These values describe how the building behaves over time: how much it emits while being used and how effectively it can cover part of its energy demand with on-site renewable production. The operational perspective therefore complements the construction analysis, showing that sustainability is not only shaped by what a building is made of, but also by how it produces and consumes energy every day.
-
-

-
Operation and on site energy use of the Bombasei-Areal
-
This first part of the story also shows that viride works with predefined typologies. It cannot capture every material layer or the exact thickness of each component, so its results should be read as approximations rather than precise calculations. Its real strength lies elsewhere: it helps answer a simple and crucial design question - where should we look closer?
From here, other tools such as EcoTool, One Click LCA, and REMMS can take over to deepen the analysis. viride provides the first sketch, the first comparison, and the first insight, setting the direction for more detailed and targeted investigations. -
EcoTool - diving deeper into materials
Tool: EcoTool
Let’s explore the Bombasei-Areal with EcoTool. Here, the focus shifts from typologies to the definition of real building layers. Instead of working with generalized construction systems, the building is described through its individual materials and components.
EcoTool begins at the scale of individual building components. It allows us to construct each element of the Bombasei-Areal layer by layer: structure, insulation, and finishes. For every layer, both the material and its thickness must be defined. This makes it possible to describe the building exactly as it is built, including renewable materials such as straw.
We start with the ground floor construction. According to the execution plans, the structure is assembled step by step, including the 750 mm layer of straw insulation. The result appears as a section that visualizes every layer of the component together with its environmental performance. It shows that each square meter of ground floor is responsible for 2.4 kgCO₂-eq/m²a of greenhouse gas emissions (THG).
By changing a material or adjusting the thickness of a layer, we can immediately see how the values increase or decrease.
-
-
Ground floor slab build up, layer by layer
-
In the Bombasei-Areal, the floors do not all have the same composition. Each situation requires a different construction logic. The floor of the underground level above the garage is made of concrete. The floor of the ground level between a heated and an unheated space contains a much thicker insulation layer, with 750 mm of straw. The upper floors between two heated spaces, as well as the balcony slabs, follow yet another stratification.
Different floor types, walls, roofs, and ceilings are therefore rebuilt individually in EcoTool. The Bombasei-Areal is no longer simplified into typologies, but represented in its full constructional complexity.
-
-
Building components of the Bombasei-Areal, built up layer by layer, with each material shown at its real thickness.
-
Once all components are built up layer by layer and optimized, we shift scale from the material level to the building as a whole. In the building optimization step, we enter the surface areas of each previously defined component.
The result is a series of diagrams showing how much each element contributes to construction-phase emissions.
For the Bombasei-Areal, the diagrams show that the floor and the windows have the greatest impact on construction-related emissions. However, in the first diagram, the photovoltaic system is not yet included. Once it is taken into account, the overall distribution changes significantly. The external walls are no longer the main contributor; instead, the photovoltaic system becomes the largest source of emissions, accounting for approximately 35% of the total construction-phase emissions. At the same time, the photovoltaic system provides locally generated renewable energy, reducing operational emissions and the overall life-cycle carbon footprint.
-
-
Which building element has the greatest impact? In the first diagram, it is the external wall. In the second, once the photovoltaic system is included, it becomes the dominant contributor.
-
The final step before running the complete simulation is to define the general project parameters that describe the building as a whole. The project is located in Zürich-Kloten at an altitude of 425 m above sea level, and the energy reference area (ERA) is set to 3,322 m². We then define the photovoltaic system with an expected annual electricity production of approximately 36,000 kWh. Finally, the building services are specified, including the heating, ventilation, and energy supply systems.
Based on these inputs, the model generates a series of graphical summaries that describe the material, energy, and CO₂ flows of the Bomber Areal, with a particular focus on greenhouse gas emissions and non-renewable primary energy demand.
-
10.3 kg CO₂-eq / m² ERA / a, Construction Greenhouse gas emissions
-
0.8 kg CO₂-eq / m² ERA / a, Operation Greenhouse gas emissions
-
44.4 kWh oil-eq / m² ERA / a, Construction Non-renewable primary energy
Overall, these results indicate that the environmental impact of the project is dominated by the construction phase, which accounts for the vast majority of both greenhouse gas emissions and non-renewable primary energy demand, while the operational phase contributes only a comparatively minor share to total CO₂ emissions.
-
-
The final step before running the complete simulation is to define the general project parameters that describe the building as a whole. The project is located in Zürich-Kloten at an altitude of 425 m above sea level, and the energy reference area (ERA) is set to 3,322 m². We then define the photovoltaic system with an expected annual electricity production of approximately 36,000 kWh. Finally, the building services are specified, including the heating, ventilation, and energy supply systems.
Based on these inputs, the model generates a series of graphical summaries that describe the material, energy, and CO₂ flows of the Bomber Areal, with a particular focus on greenhouse gas emissions and non-renewable primary energy demand.
-
10.3 kg CO₂-eq / m² ERA / a, Construction Greenhouse gas emissions
-
0.8 kg CO₂-eq / m² ERA / a, Operation Greenhouse gas emissions
-
44.4 kWh oil-eq / m² ERA / a, Construction Non-renewable primary energy
Overall, these results indicate that the environmental impact of the project is dominated by the construction phase, which accounts for the vast majority of both greenhouse gas emissions and non-renewable primary energy demand, while the operational phase contributes only a comparatively minor share to total CO₂ emissions.
-
The diagram shows the results of the EcoTool simulation for non-renewable primary energy (PENE) and greenhouse gas emissions (GHG) per square meter of gross floor area per year.
One Click LCA - Whats about the whole cycle of life?
Tool: OneClick LCA
Do you want to know more about the ecological profile of the Bombasei-Areal? Let’s explore it with One Click LCA. For the Bombasei-Areal in Nänikon, we select Switzerland as the project location. This choice is fundamental because it automatically links the model to the KBOB catalogue, which provides standardized environmental data according to Swiss norms.
The most data-intensive step is the resource input. Here, the Bombasei-Areal is translated into a complete material inventory. Every material used in the project is selected from the KBOB library and assigned its quantity in m², m³, or kg.
Resources are organized into predefined categories: Foundations and substructure, Load-bearing structure and façade, Horizontal structures, Other building materials and structures, and External elements on the construction site.
To keep an overview, materials can be grouped freely. For example, all resources belonging to the external walls of the Bombasei-Areal can be collected in a group called Aussenwände über dem Terrain. This preserves the logic of the construction while working with individual datasets.
Building and Material Submission
Each material entry is directly linked to the KBOB catalogue. By clicking the information icon, technical properties and environmental indicators become visible, ensuring that every component of the Bombasei-Areal is based on verified and comparable data. Taking the straw insulation (Stroh) as an example, the dataset provides technical information such as density (215 kg/m³) and environmental indicators such as the Biogene CO₂ Gebundenheit (0.37 kg CO₂e/kg). Biogenic carbon storage is shown separately, allowing the climate effect of Bombasei’s bio-based materials to be made visible while maintaining comparability with conventional materials.
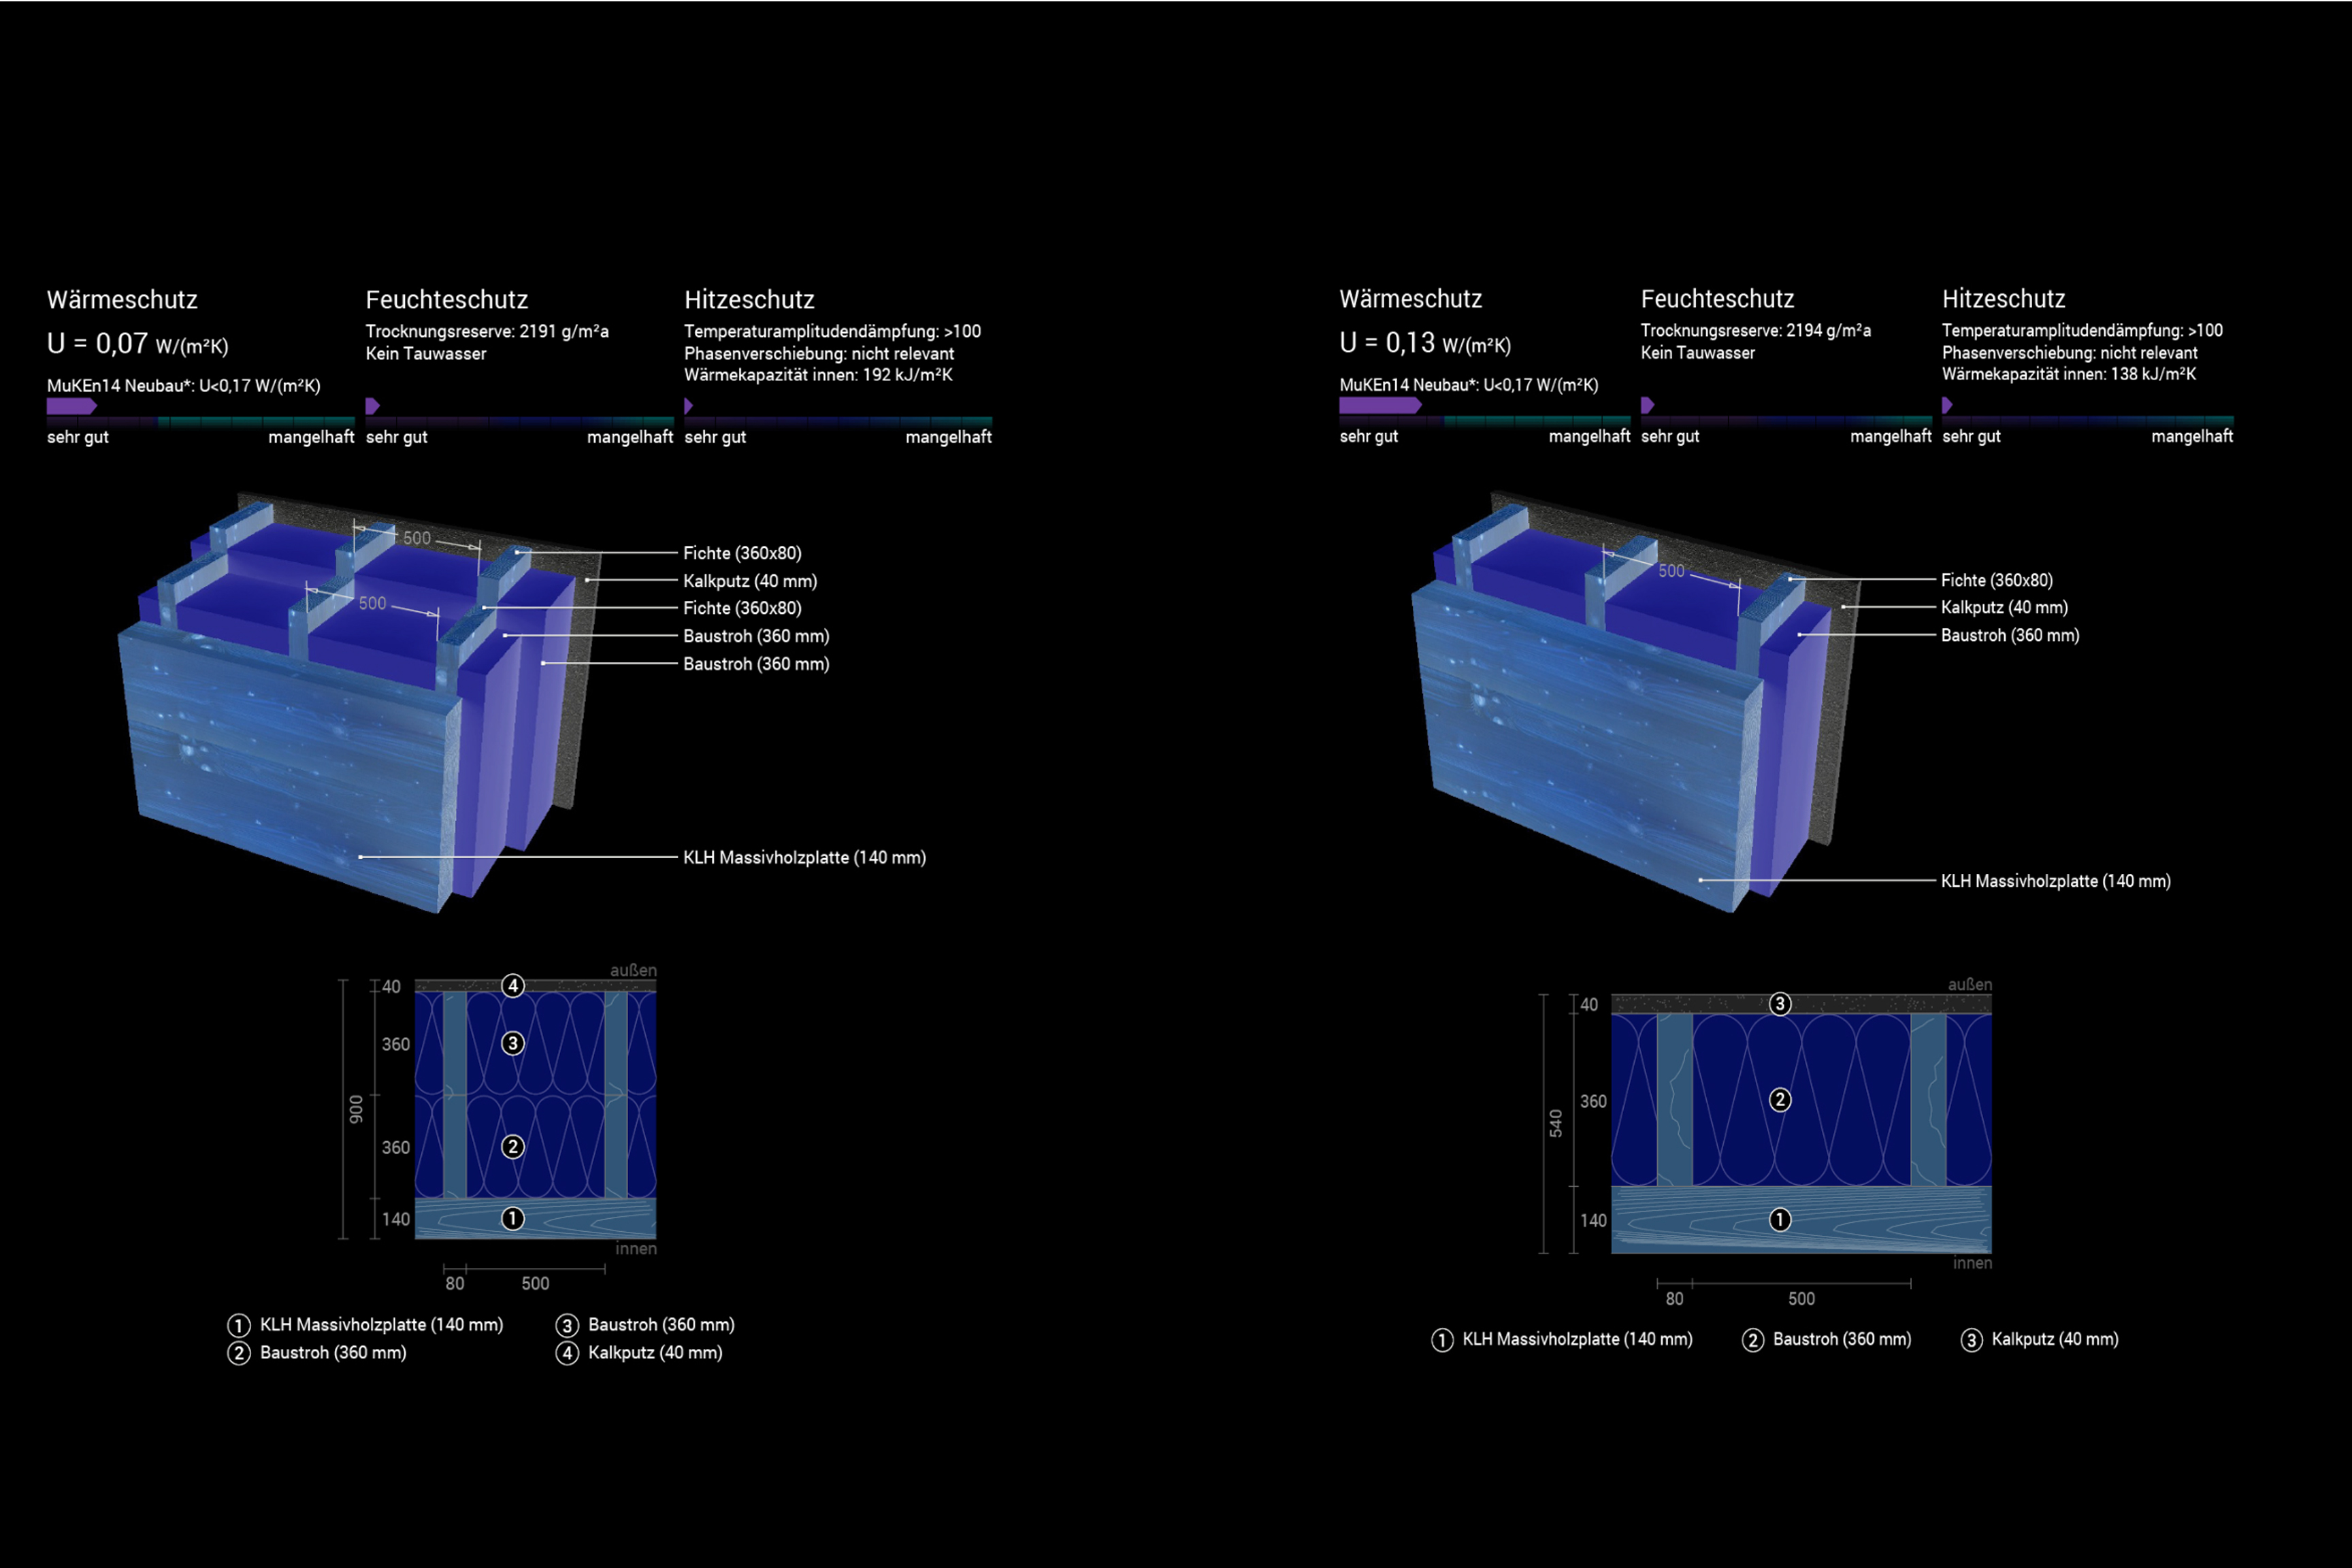
The datasets also include a recommended standard thickness, usually around 100 mm. In the Bombasei-Areal, however, the straw insulation is applied at about 750 mm. This is a deliberate design strategy aimed at reducing the U-value as much as possible. A comparison using Ubakus makes this effect clear: with 360 mm of straw, the U-value is approximately 0.13 W/m²K, while with 750 mm it improves to about 0.07 W/m²K.

Comparison of two external wall systems differentiated by the thickness of the straw insulation layer.
Once all resources have been entered and the results are generated, EcoTool provides a series of graphs that give an overview of the life cycle of total embodied primary energy. The tool offers different graphical representations of the same data, allowing the results to be read from multiple perspectives. These can be displayed as pie charts, bar charts, column charts, and treemaps.
Looking at the diagram by resource type, we can quickly see that plywood is one of the main contributors to embodied primary energy. This is not due to a particularly high impact per unit, but rather to the very large quantity of plywood used throughout the project.
Embodied energy by resource type
Until now we habe watch most closely to resources and materials, what about the whole life cicle?
For the Bombasei-Areal, the life-cycle breakdown of total embodied primary energy (MJ/m²/year) shows a clear dominance of the production phase:
- A1–A3 Production: 87.0%
- B4–B5 Replacement: 11.6%
- B4–B5 Waste from replacement: 0.1%
- C1–C4 End of Life: 1.3%
This shows that most of the embodied primary energy is concentrated at the very beginning of the building’s life, during material extraction and manufacturing. Replacement processes and end-of-life phases play only a minor role in comparison.
Total Embodied Primary Energy (MJ/m²/year) across Life Cycle Phases
REMMS - The social layer of sustainability
Tool:REMMS
After VIRIDE and EcoTool, we shift our focus once more. With REMMS, we stop looking only at materials and layers and start reading the Bombasei-Areal as a living system. REMMS asks a broader question: how well does this place actually work for people, for the climate, and for the economy at the same time?
REMMS works with remarkably few inputs. We enter the location, the usable floor area, the year of construction, the heating system, the number of floors, and the construction type. We then add basic energy indicators such as the energy class and the efficiency of the building envelope. In addition, REMMS introduces a social layer through direct questions, for example: Does the building promote meaningful social interaction between users or residents?
This question already shows how REMMS shifts the perspective. Sustainability is no longer only about energy and emissions, but also about everyday life and comfort.
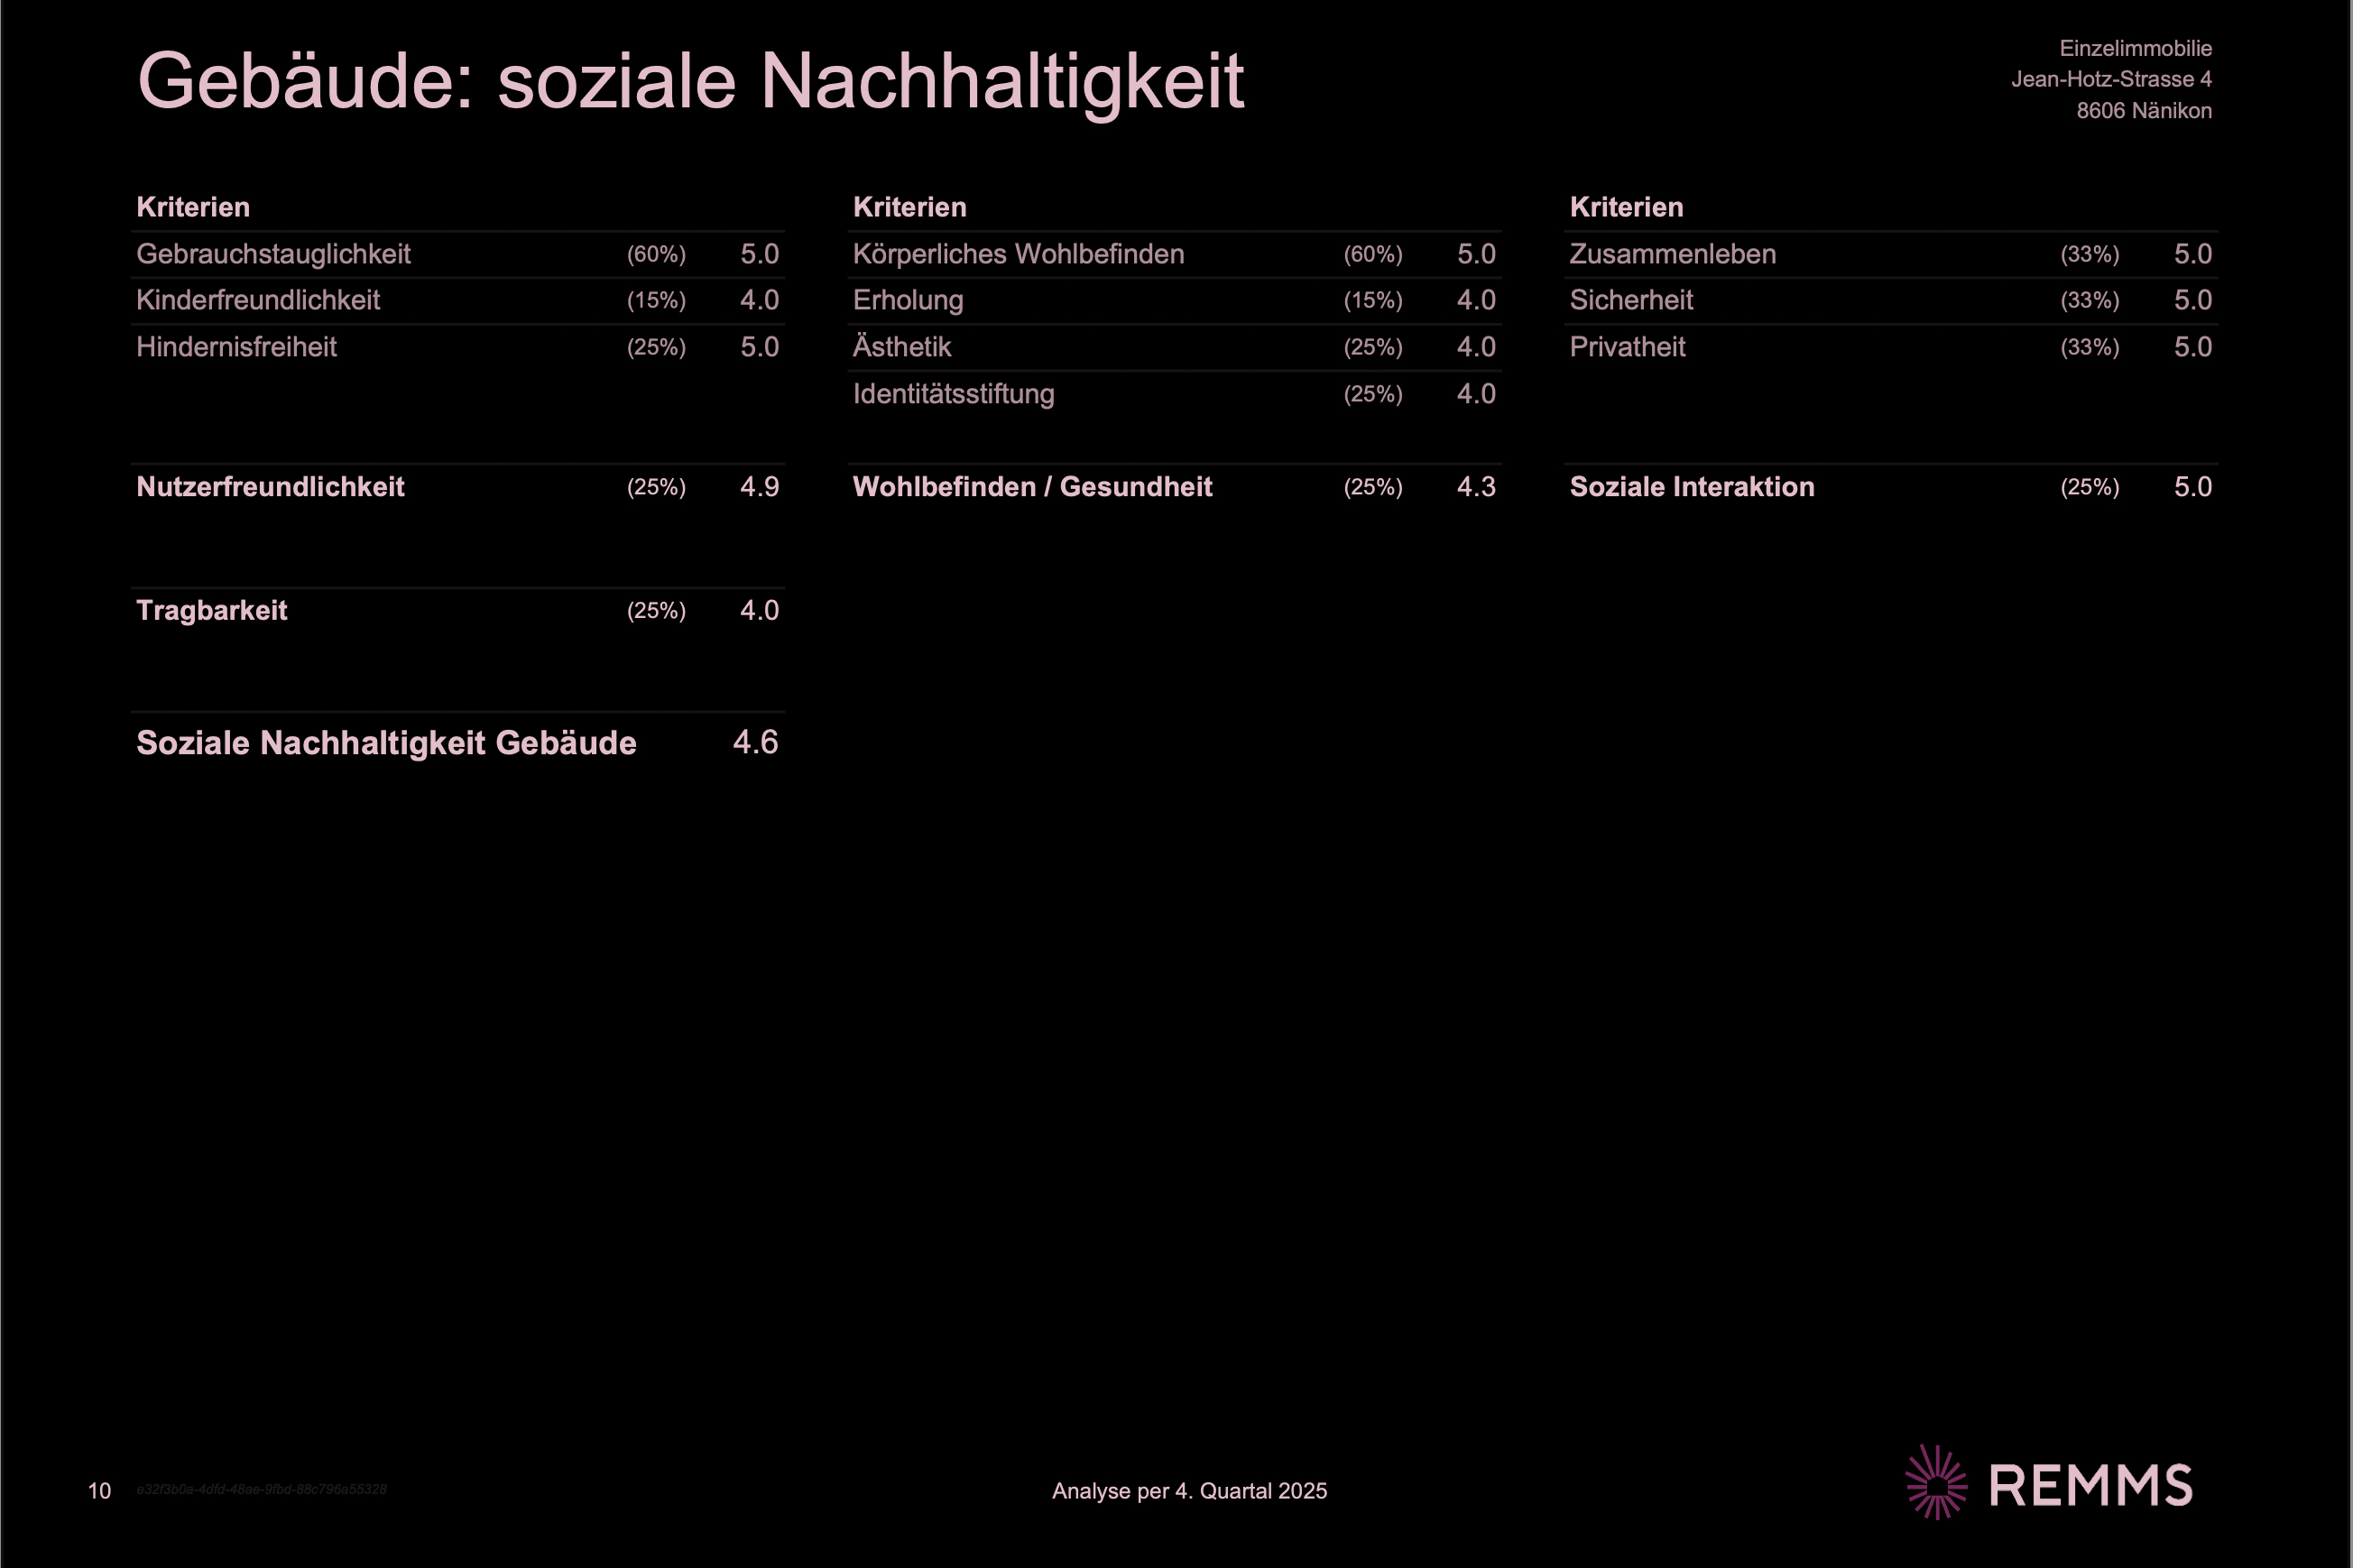
For the Bombasei-Areal, the social results are strikingly strong. The building reaches an overall score of 4.6 out of 5 in social sustainability. This confirms that the project does not only perform ecologically, but also succeeds as a place to live.

Result of the social sustainability assessment of the settlement.
Do you have questions or comments?
The comparison shows that each tool observes the Bombasei-Areal at a different scale and resolution. VIRIDE provides a fast, typology-based overview, EcoTool enables a detailed layer-by-layer material assessment, and One Click LCA extends the analysis to a full life-cycle perspective. Used together, they form a complementary system that connects early design approximations with precise material data and long-term environmental performance. Would you like to share your own experience with these tools, or are you interested in learning more about how they can be applied in practice? We invite you to continue the discussion and post your thoughts, questions, or insights in the forum.