Tool: GHG Emissions Timeline
Understanding a building’s emissions means knowing not only how much carbon is released, but also when.
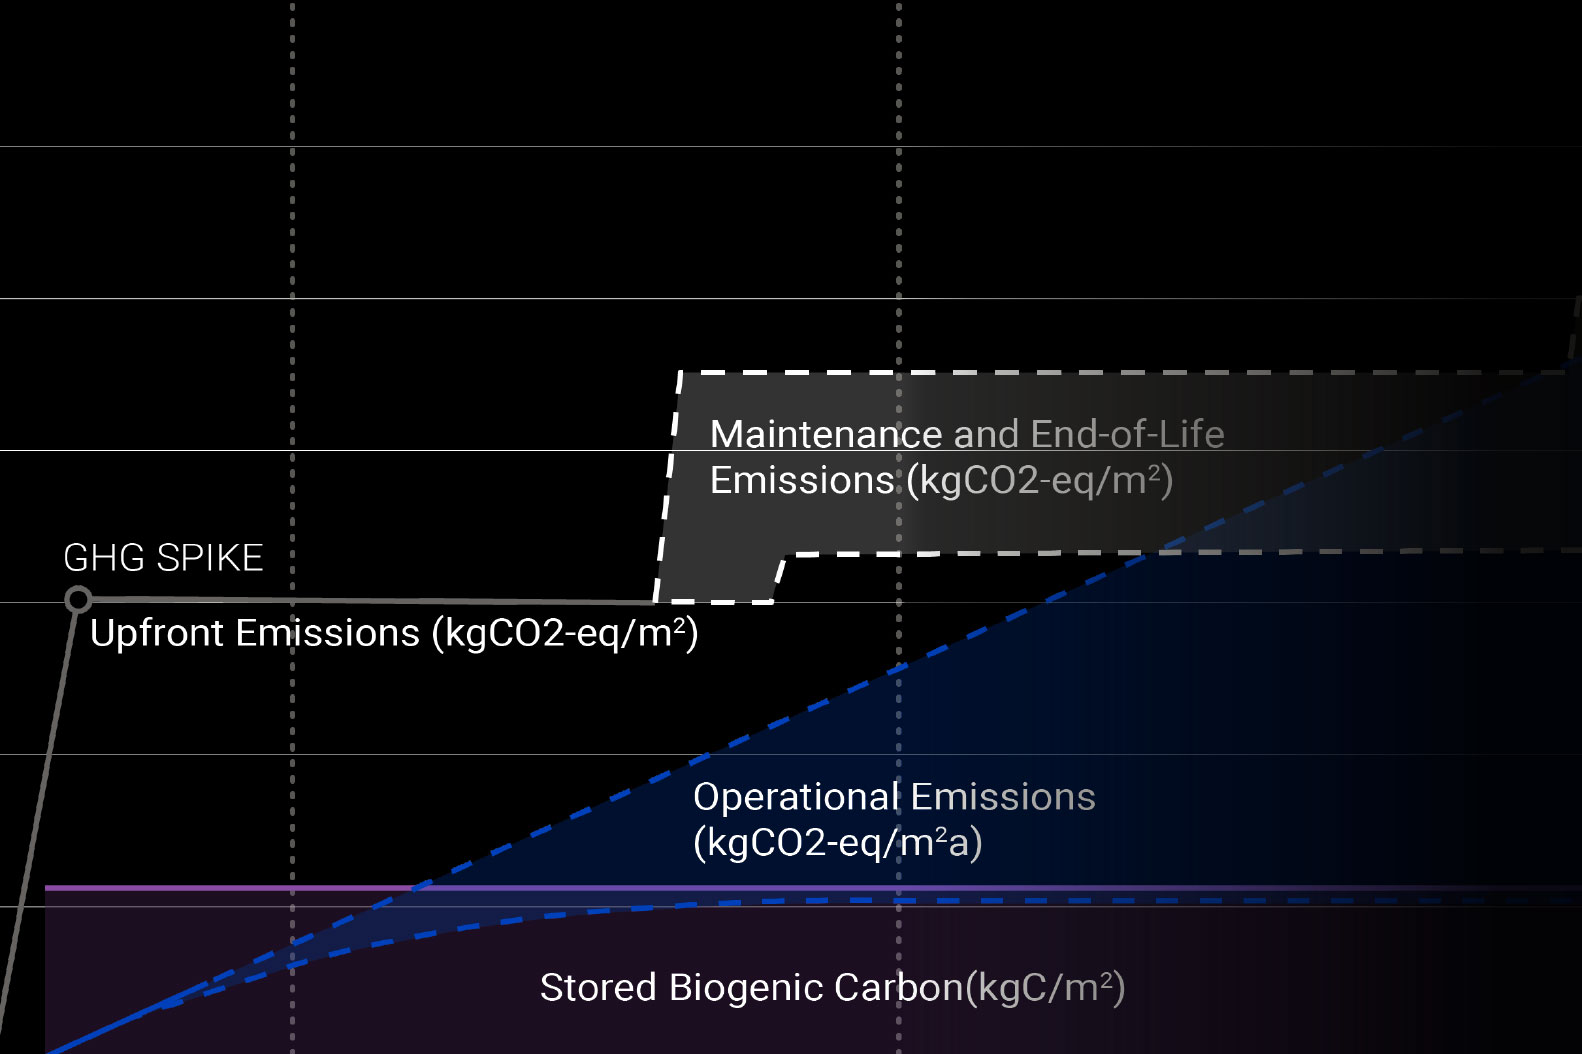
The GHG Emissions Timeline makes visible what usually remains hidden: the moment carbon is emitted throughout the building’s life cycle.
Unlike a traditional LCA, which gives a single number, the timeline dynamically shows how emissions evolve over time, highlighting design choices and their impact.
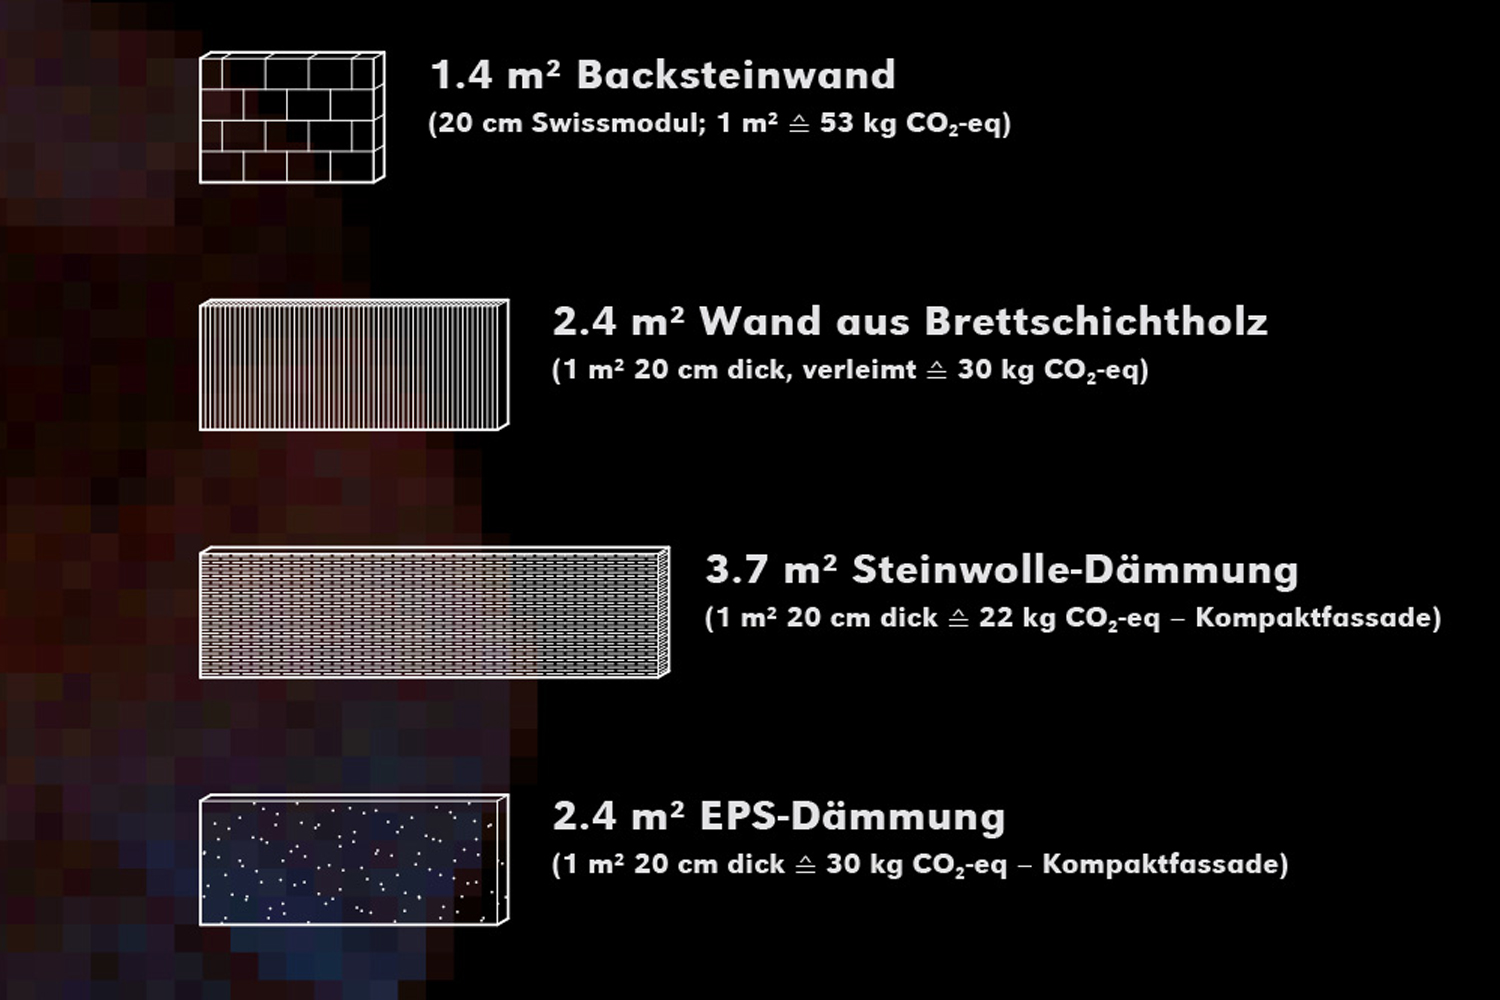
Bands, lines and icons illustrate quantities, uncertainties and key events, such as system changes or construction phases, adapting to surface area, users or other parameters.
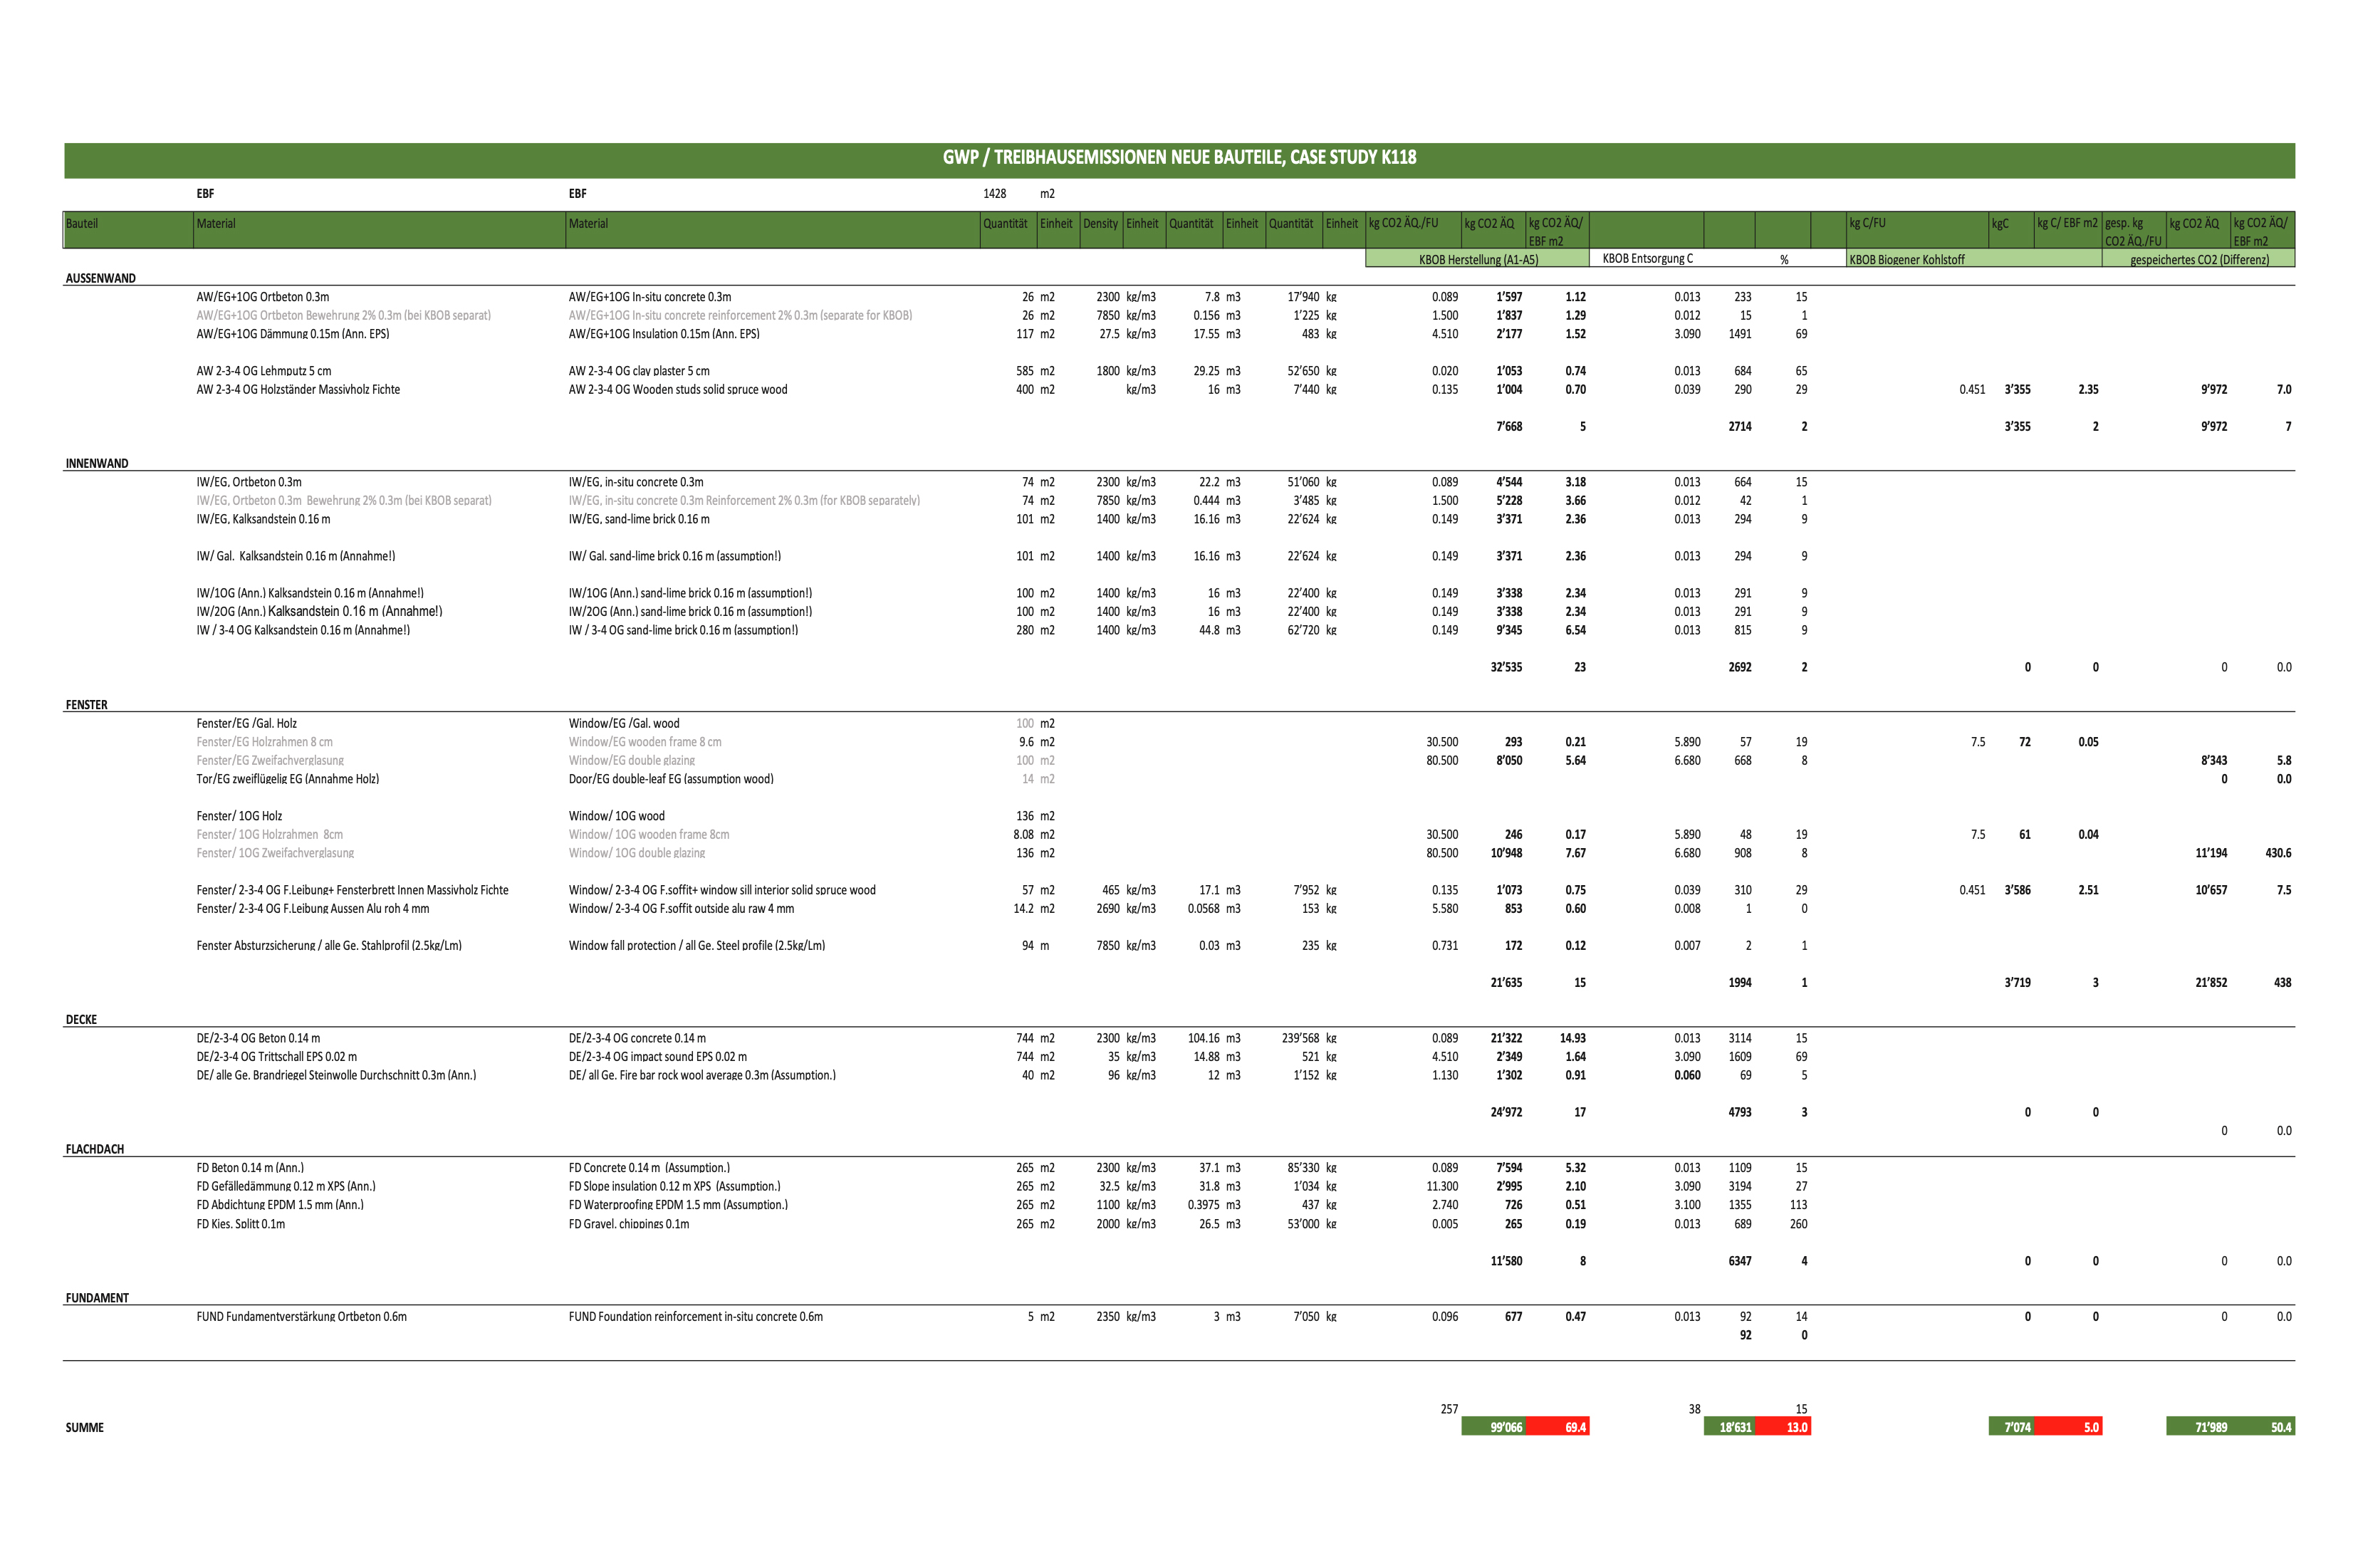
In the case of Gewerbehaus K118, the timeline reveals how reuse strategies and natural materials helped reduce emissions from the very first stages.
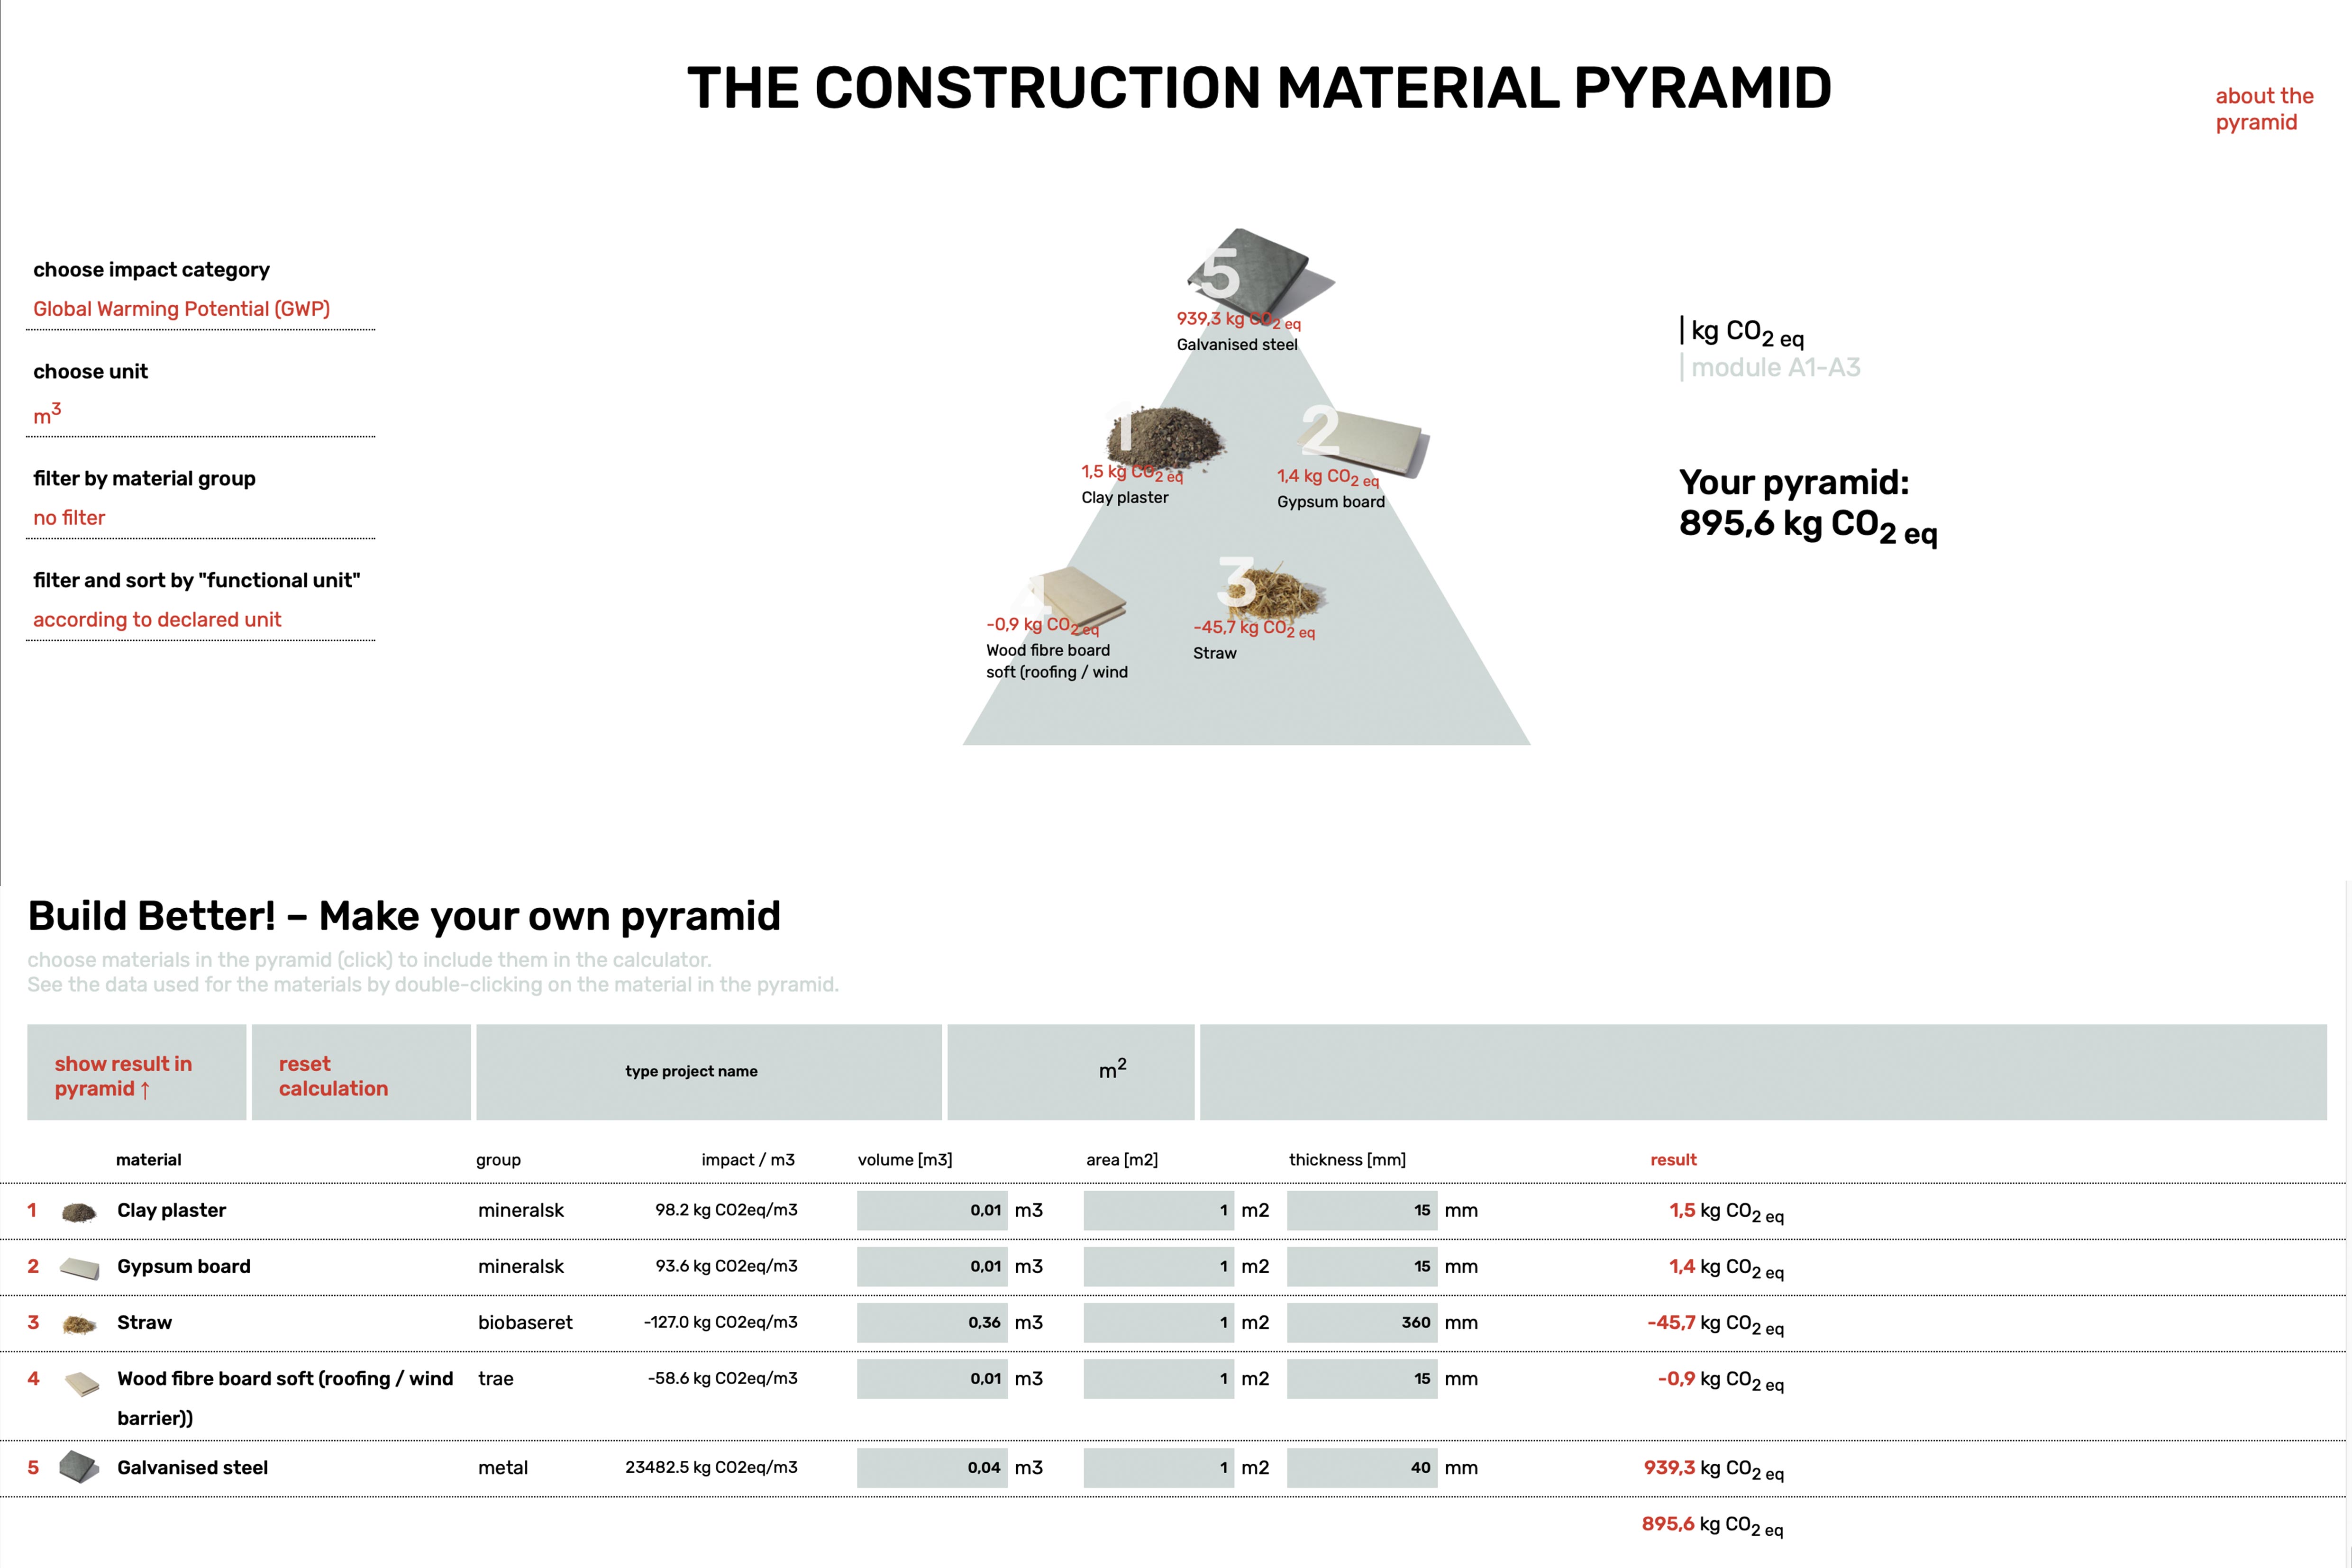
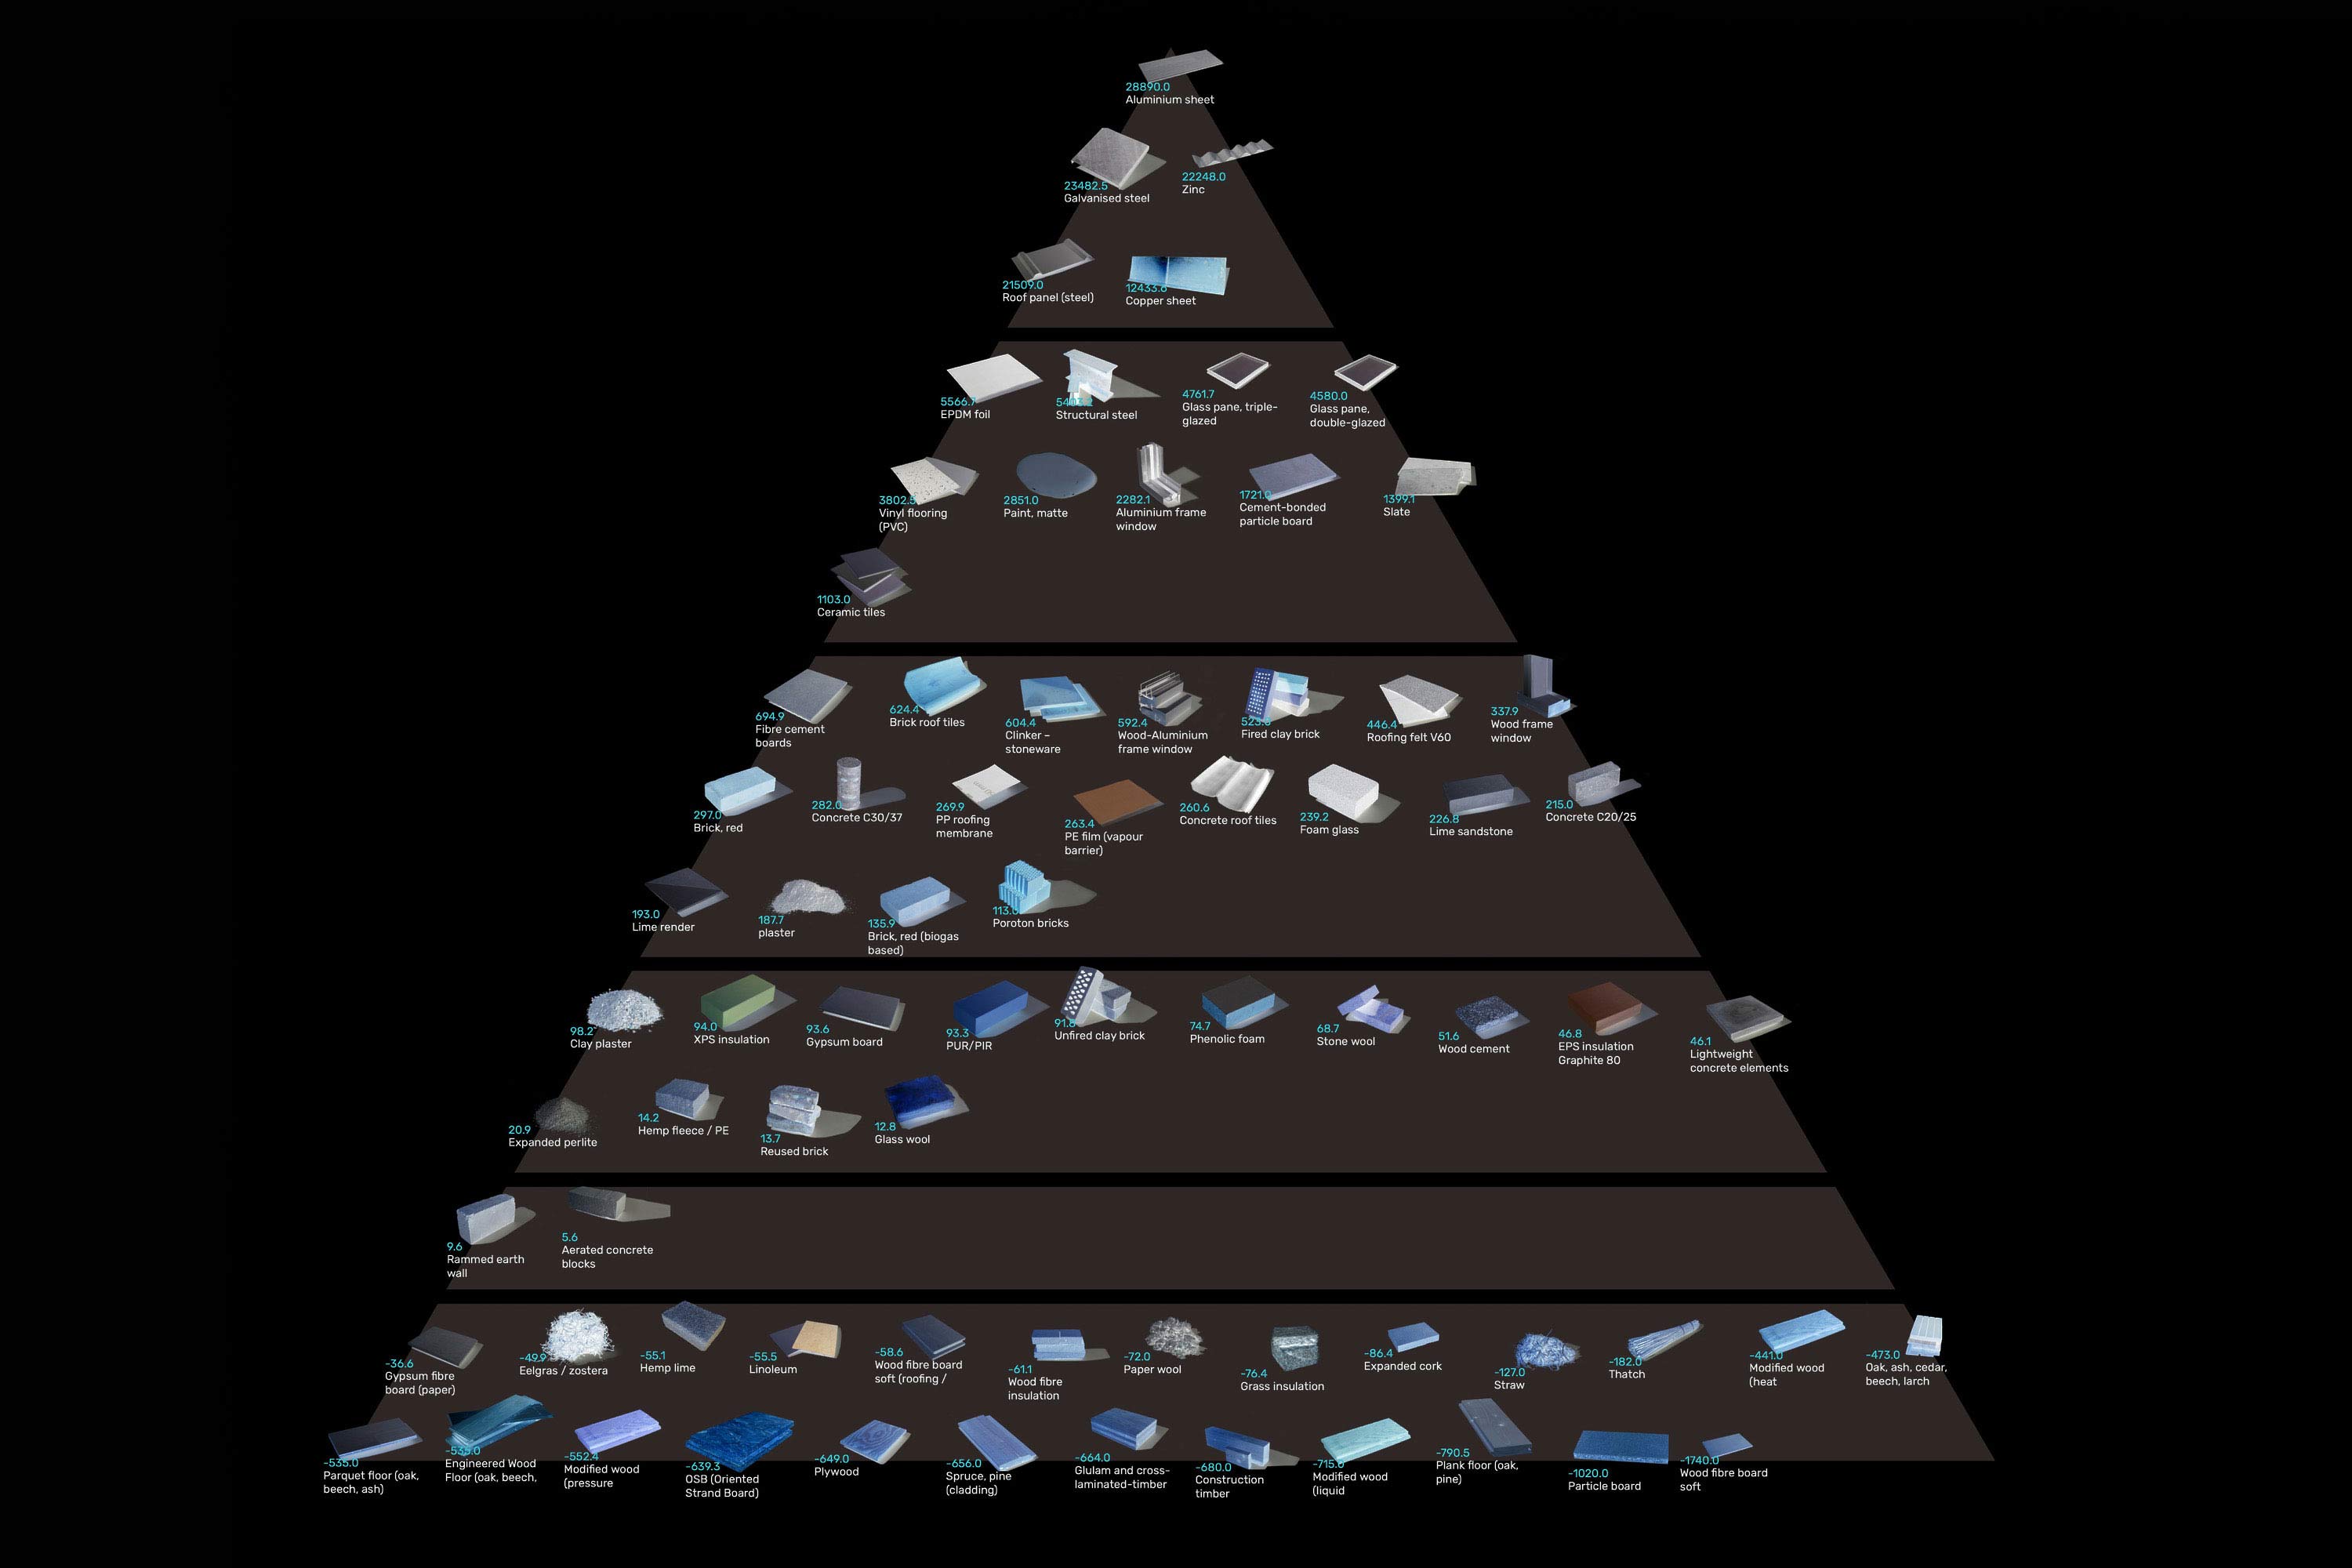
Production (A1–A3): The reuse of structural elements from a dismantled warehouse dramatically reduces emissions in this phase, especially compared to producing new steel or concrete.
Construction (A4–A5): Transport and on-site assembly still generate emissions, but the compact logistics and local sourcing in K118 help keep these relatively low.
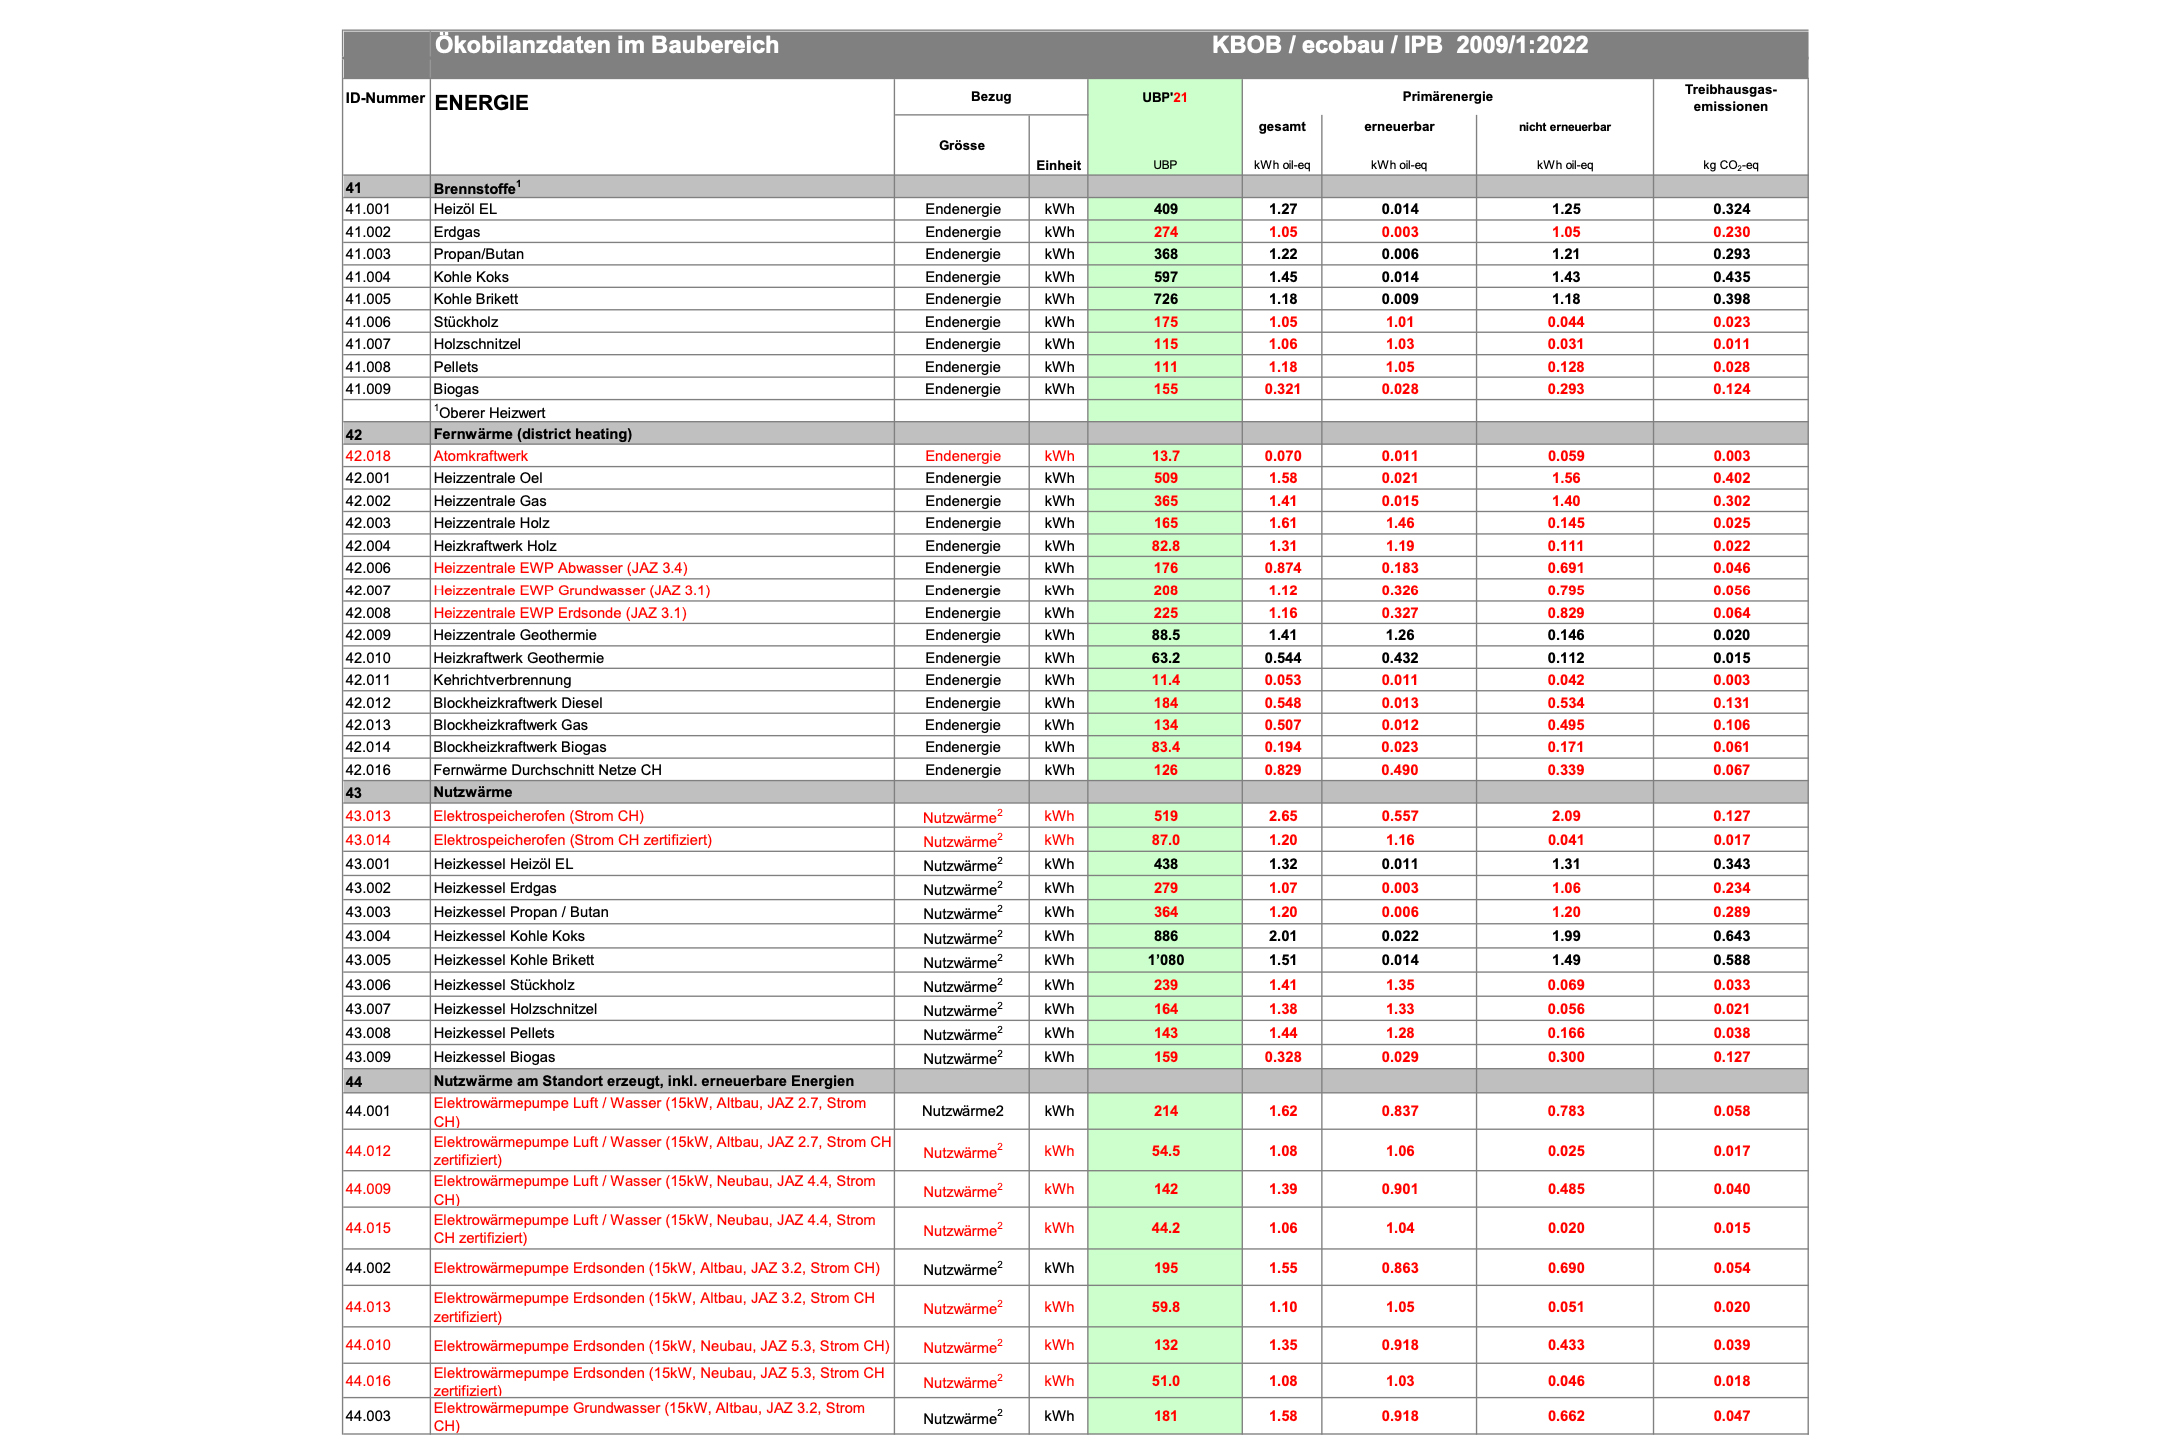
Use phase (B1–B7): Over the next 80 years, emissions depend mostly on heating and electricity. With energy-efficient design and photovoltaics, operational emissions remain minimal.
End-of-life (C1–C4): Although predicting the future is difficult, K118 is designed for disassembly. The emissions forecast assumes that most materials can be reclaimed again, reinforcing the building’s circular vision.
This approach allows designers, students, and stakeholders to understand not only how much carbon is emitted, but also when it occurs, making the building’s environmental impact visible and supporting better, more sustainable decisions throughout its lifetime.

 Photo: baubüro in situ ag